
What’s behind record PSU Bank profits?

Our goal with The Daily Brief is to simplify the biggest stories in the Indian markets and help you understand what they mean. We won’t just tell you what happened, we’ll tell you why and how too. We do this show in both formats: video and audio. This piece curates the stories that we talk about.
You can listen to the podcast on Spotify, Apple Podcasts, or wherever you get your podcasts and watch the videos on YouTube. You can also watch The Daily Brief in Hindi.
In today’s edition of The Daily Brief:
What’s behind record PSU Bank profits?
The wires & cables industry surges through
What’s behind record PSU Bank profits?
The December quarter of FY 2026 feels like the final nail in the coffin for that old PSU bank stereotype: of bad loans, bailouts, and permanent underperformance.
The picture couldn’t look better. All 12 public sector banks posted their best-ever profits this quarter. And according to the Financial Services Secretary, the cumulative profits of all PSU banks are on track to cross ₹2 lakh crore in FY26, for the first time ever.
Look at the big three PSBs — SBI, Bank of Baroda, and Punjab National Bank. They reported strong profits, while simultaneously achieving better asset quality and steady growth. We may well be in a “Goldilocks” phase for PSU banks: a stretch where public banks are competing seriously with private banks; a “new normal” after a decade-long lull.
This shift has been building for a while. But this quarter just makes the story hard to dismiss.
So we decided to take a closer look. We’ve already spent time on what’s happening with private banks this earnings season. It’s only fair to run the same lens over PSU banks.
By the Numbers
Before diving into the trends, let’s quickly look at the scoreboard.
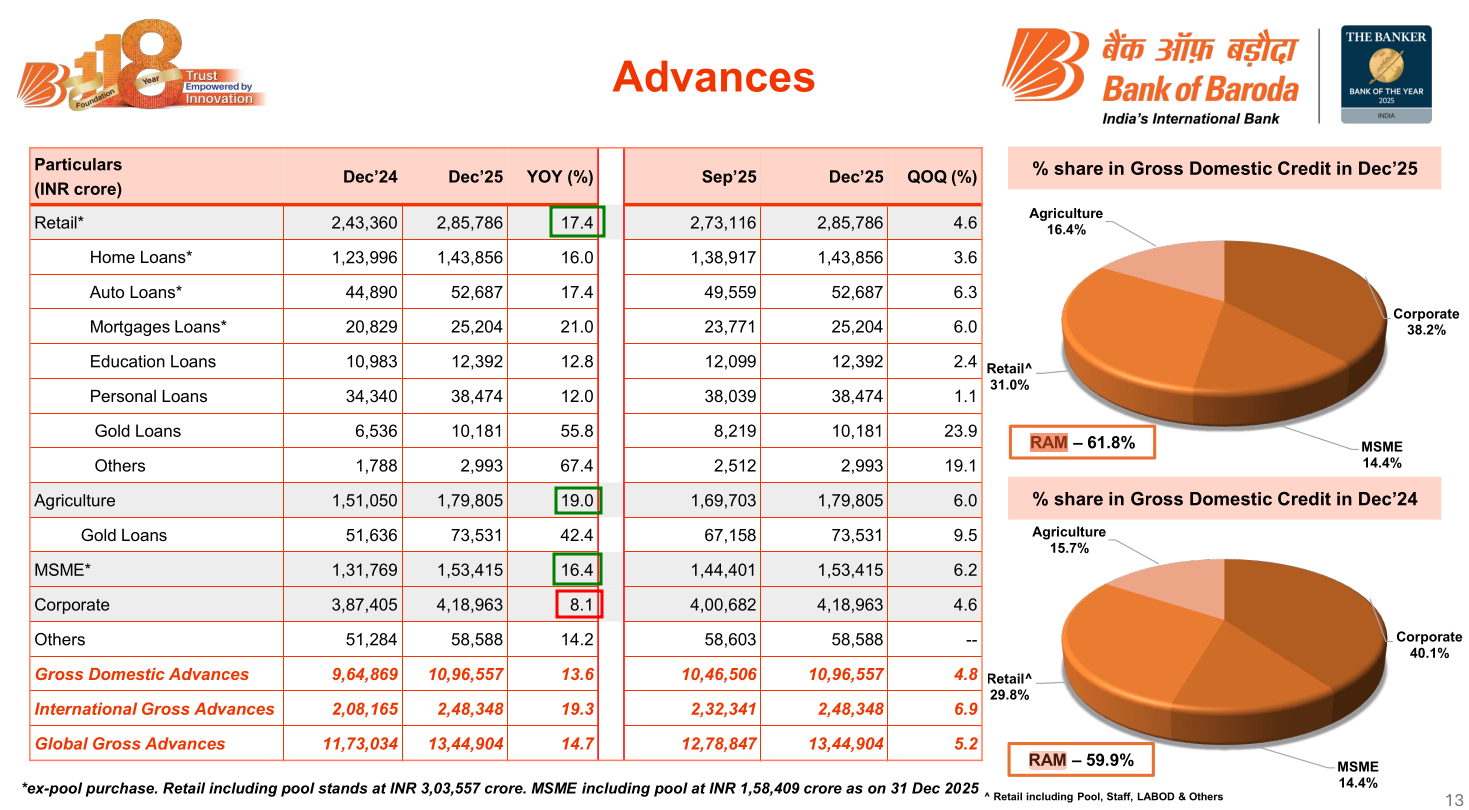
SBI posted its highest-ever quarterly net profit — at ₹21,028 crore, up 24.5% year-on-year. PNB and BoB came in at a more modest ~₹5,100 crore each, growing ~13% and ~4.5% YoY respectively.
The more important signal, though, is this: all three delivered a Return on Assets (ROA) above 1%. That mark used to be an aspirational ceiling for banks until recently. Now, it’s starting to look like the baseline.
What does that mean? A bank’s ROA tells you how much profit a bank is making for every rupee of assets it carries. Those “assets,” for a bank, are mostly its loan book and investment book. So when its ROA improves, it usually means the bank is either earning better on its assets, running more efficiently, or bleeding less from bad loans. Often, it’s a mix of all three.
This quarter, much like the last few quarters, asset quality was a big part of that story, which is now at multi-year bests. SBI’s gross NPA fell to 1.57%. BoB isn’t far behind at 2.04%. And even PNB — historically the laggard — improved to 3.19%. In plain terms: bad loans have stopped being a major drag on profits.
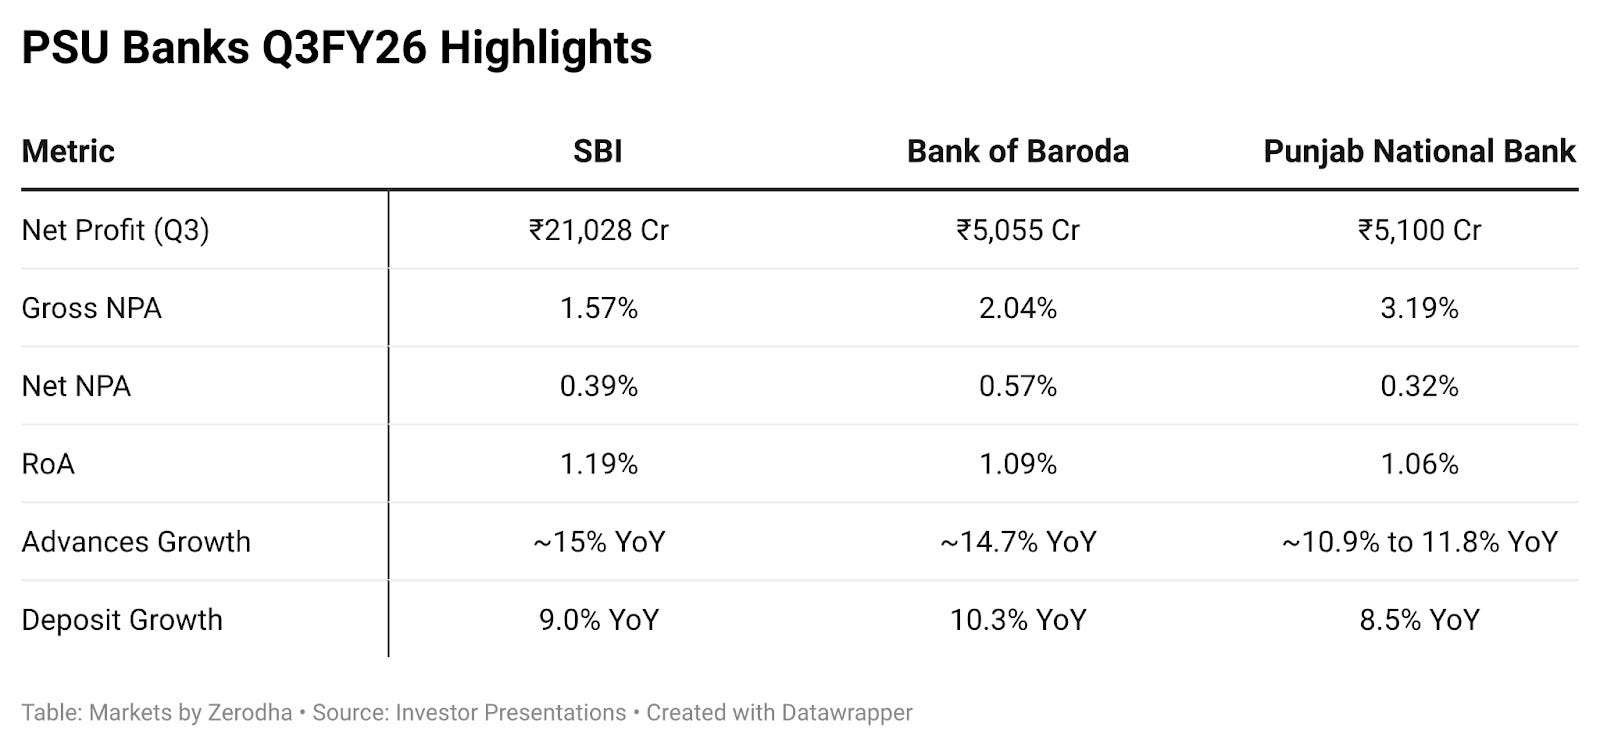
They saw sharp growth as well. SBI’s loan book crossed ₹46 lakh crore, growing ~15% over the year. BoB’s advances rose ~14.7% year-on-year, while PNB’s were around ~11%. Double-digit growth across the pack.
You can see some strain in funding, however. Deposit growth has been slower than loan growth, which has pushed their credit-to-deposit (CD) ratios up. That is, a larger proportion of their deposits are being lent out. When deposits don’t grow fast enough, banks have two options. One, they slow down lending. Or two, they pay up for deposits, to attract more and keep funding growth. Most banks are choosing the second route right now — higher deposit rates to protect liquidity.
That extra cost, however, shows up as pressure on margins. And so, the margins were mixed. SBI managed to keep its net interest margin relatively steady, but BoB and PNB saw some margin compression.
There are a few things, though, that warrant a deeper probe.
Profitability Breaks Past the 1% ROA Barrier
For the first time in recent memory, India’s state-run banks are putting up profitability that looks… private-bank-like. Importantly, this doesn’t look like a one-off windfall. It’s core operating performance that’s delivering these returns.
What are they doing differently? At a high level, it comes down to two things: banks are earning decently on their assets, and they’re bleeding far less on provisions.
Even in a quarter where margins were under pressure, their net interest income is either rising or holding up. That’s subtle, but important: a bank can have slightly lower margins and yet, grow its total interest income — if it’s giving out more loans, and more profitable loans, such as those to retail or MSMEs.
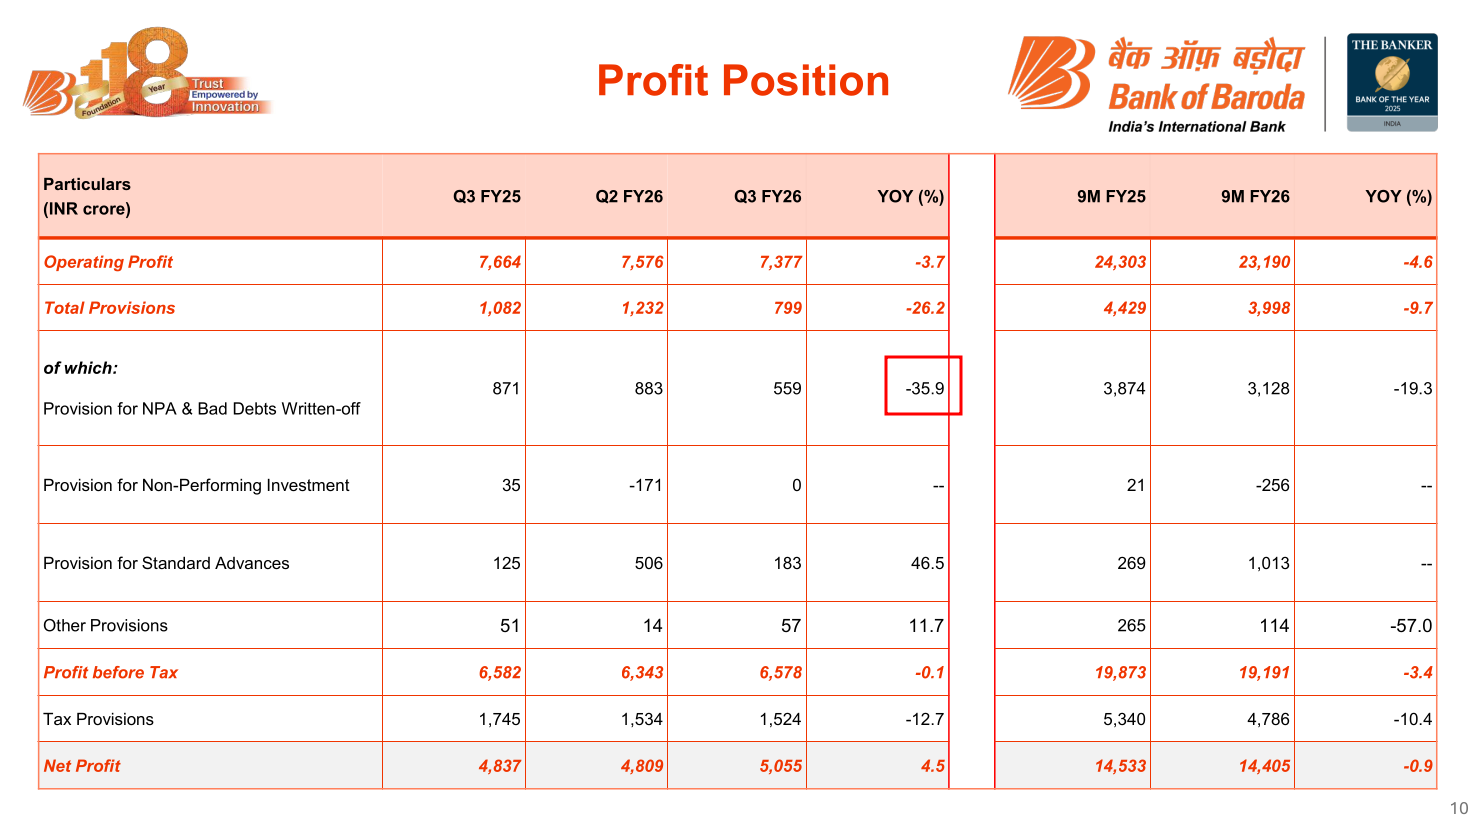
Then, there’s a provisioning angle. These banks have spent years cleaning up their balance sheet, and the results are finally visible in their financials. With fewer bad loans, the “tax” of provisioning is lower. Bank of Baroda, for example, saw a ~36% YoY drop in NPA provisions this quarter — and that falls straight to the bottom line.
These banks are also pushing visibly on efficiency.
Banks usually keep tabs on their cost-to-income ratio: or what portion of their net income from interest goes into running their operations. For SBI, this has reached a genuinely competitive level of roughly 48%. Management expects it to stay around 50%. A lot of a bank’s costs — branches, staff, tech — don’t rise linearly with every extra rupee of business. So when a mature bank like SBI grows its book without bloating costs, the cost-to-income ratio stays stable or trends down. And that’s what you want to see.
You can see these shifts in the tone you hear from management.
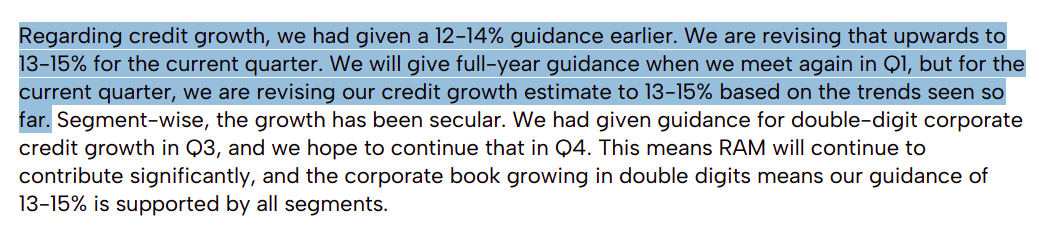
They’re no longer talking like they’re still climbing out of a hole. They seem confident; like they’ve found a rhythm. SBI, for instance, raised its FY26 credit growth guidance to 13–15%, from 12–14% earlier, on the back of strong demand. It also reiterated that it wants to keep NIM above 3% going forward.
The subtext is clear: PSU banks think they’ve built a sturdier earnings base than the market gives them credit for.
If that belief holds — if an ROA of 1%+ becomes routine — it could change how investors look at the entire PSU bank pack. Historically, these stocks have traded at a discount to their book values, because the market assumed their profits were fragile and credit costs could blow up anytime. But stable profits and predictable asset quality are a recipe to shrink that “volatility discount”.
Could a potential stock re-rating be on the cards.
The Growth Gap
To be fair, it’s not all as rosy as the RoA figures and headlines suggest.
One challenge, as we highlighted earlier, is the widening growth gap between credit and deposits. PSBs started from a more comfortable place than many private banks. Traditionally, PSU banks had lower CD ratios — in the 70-75% range — compared to the 85-90%+ in some private banks. Even after recent increases, PNB’s CD ratio is about 74%, and SBI’s ~73-81%. This isn’t alarming yet.
But there’s an undeniable trend: the gap is narrowing. Credit demand seems “robust across all segments” while deposit growth is harder to come by.
Credit demand could be a good thing. But why are deposits lagging?
Part of it is the “CASA squeeze”. Customers have more choice around where to park their money, and they’re moving money from low-interest savings accounts (CASA) to higher-rate fixed deposits — or even to mutual funds and other instruments. That’s what you see here. PSU banks’ data shows term deposits growing much faster than total deposits. PNB’s term deposits, for instance, were up 10.4% year-on-year, compared to 8.5% overall growth. Low-cost CASA growth is nearly flat. In fact, all three banks saw their CASA ratios decline slightly.
This broad trend has sparked intense competition across the system for deposits – the so-called “deposit war”. Banks are advertising ever-higher FD rates to lure savers.
The PSU banks’ approach to this challenge, meanwhile, has been relatively measured. They are not chasing expensive wholesale deposits aggressively. PSBs came into this cycle with surplus liquidity — remember, during the pandemic, PSU banks had more deposits than they could lend. They aren’t desperate or “deposit-starved” to the same extent as some private competitors.
But if things stay the same, the growth gap is worth watching.
PSBs Pivot to High-Octane Retail Segments
PSU banks have also shed their old-school image of being boring lenders — lending solely to big corporates, while the flashier work of drawing retail customers is left to private banks. Now, PSUs too are expanding aggressively into retail and other high-yield segments.
This pivot was clearly visible last quarter: they’re growing Retail, Agriculture, and MSME (RAM) loans faster than corporate loans. They’re also targeting niche segments like vehicle loans, gold loans, and personal loans.
BoB’s retail loans, for instance, grew at 17.4% YoY — double the pace of its corporate loan growth (8%).
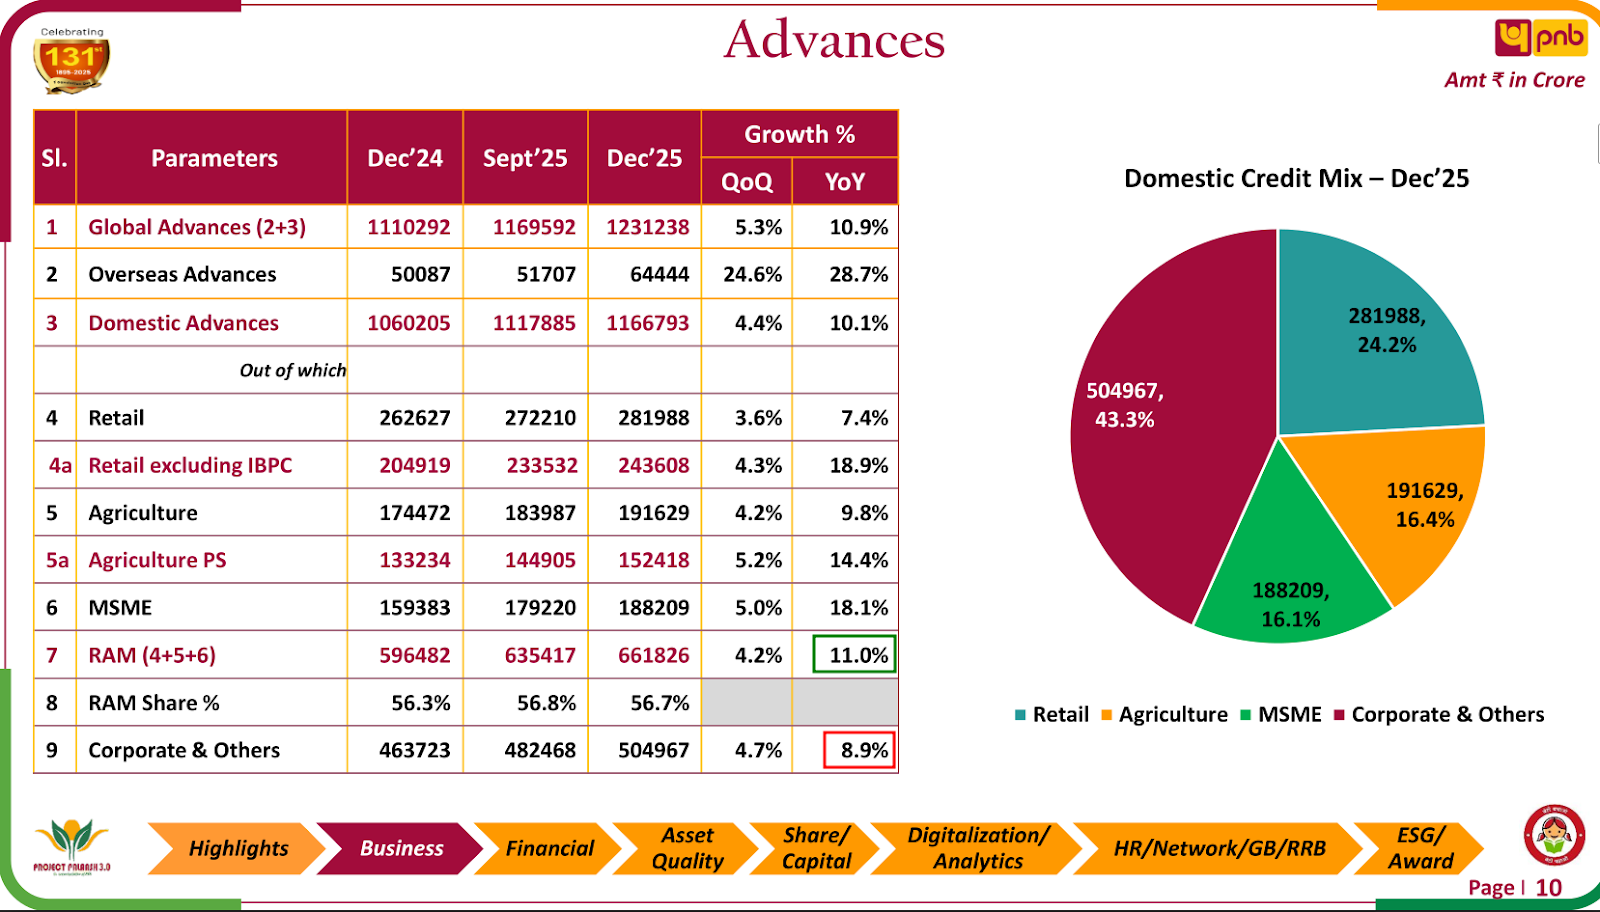
PNB — which lagged in retail for years — saw its RAM book growing 11%, outpacing its corporate book growth of ~9%.
After years of cleaning up and recapitalization, it appears, PSBs finally have the appetite and ammunition to go after retail customers. They’re making up for lost time from the late 2010s, when private banks cornered the retail market as PSBs struggled with bad loans. Now, with healthier balance sheets and sufficient capital, PSBs can afford to expand consumer lending. Interestingly, this comes right as private sector banks are taking the foot off the retail pedal.
The road ahead
This was a genuinely strong quarter for PSU banks. But if you’re thinking ahead, which you should, keep an eye out for a few pressure points over the next couple of quarters.
So far, PSU banks have mostly avoided the full-blown “deposit war” that private banks have been fighting. They started this cycle with relatively comfortable credit-to-deposit ratios, so their scarcity of deposits hasn’t turned into a crunch just yet. But that could change if the current pattern continues, and their loan growth keeps outpacing deposit growth. Eventually, PSBs could face the same choice everyone does: slow down lending, or pay up for deposits.
The ~1% ROA they’re now generating gives them breathing room. It doesn’t solve their deposit problem, but it does mean they can afford to spend more on funding without immediately breaking the earnings engine. The question is how far that buffer can stretch if the competition for deposits intensifies.
These banks are also riding a tailwind: as their NPAs have fallen, they’ve seen an easy profitability boost from falling provisions. But NPAs don’t fall forever — not from already-low levels. At some point, they plateau. And when that happens, the tailwind disappears.
And finally, there’s a more subtle risk: the next phase of growth for PSBs, it appears, is increasingly retail-heavy. That’s good for yields and diversification — but retail growth also means you’re exposed to a different kind of stress. If specific pockets start cracking, you’ll start seeing slippages, as the share of bad loans goes up. And then, credit costs could follow.
None of this is a prediction. But knowing how banking cycles go, it’s worth asking: are PSU banks in the middle of a “new normal” — structurally stronger, consistently profitable, and finally re-rated? Or are we simply near the peak of a good cycle, with the fall yet to begin?
The wires & cables industry surges through
We’ve now covered the wires and cables (W&C) industry across two quarters — first breaking down how the business works during Q1, then tracking the shift towards cables and exports in Q2.
This time, the Q3 results are out, and some of the firms just posted their best quarter ever. All the tailwinds we’ve flagged in our earlier stories — rising public capex, a real estate boom, the push for renewables — have only gotten stronger.
But what makes these results more impressive are how the companies handled the bottlenecks. They had to navigate a sharp spike in the prices of copper, which is the single biggest input cost in the industry. Only recently, we covered the state of the world’s copper crunch. How they handled that spike reveals a lot about how differently each company plays the game.
The numbers
Let’s start with the numbers.
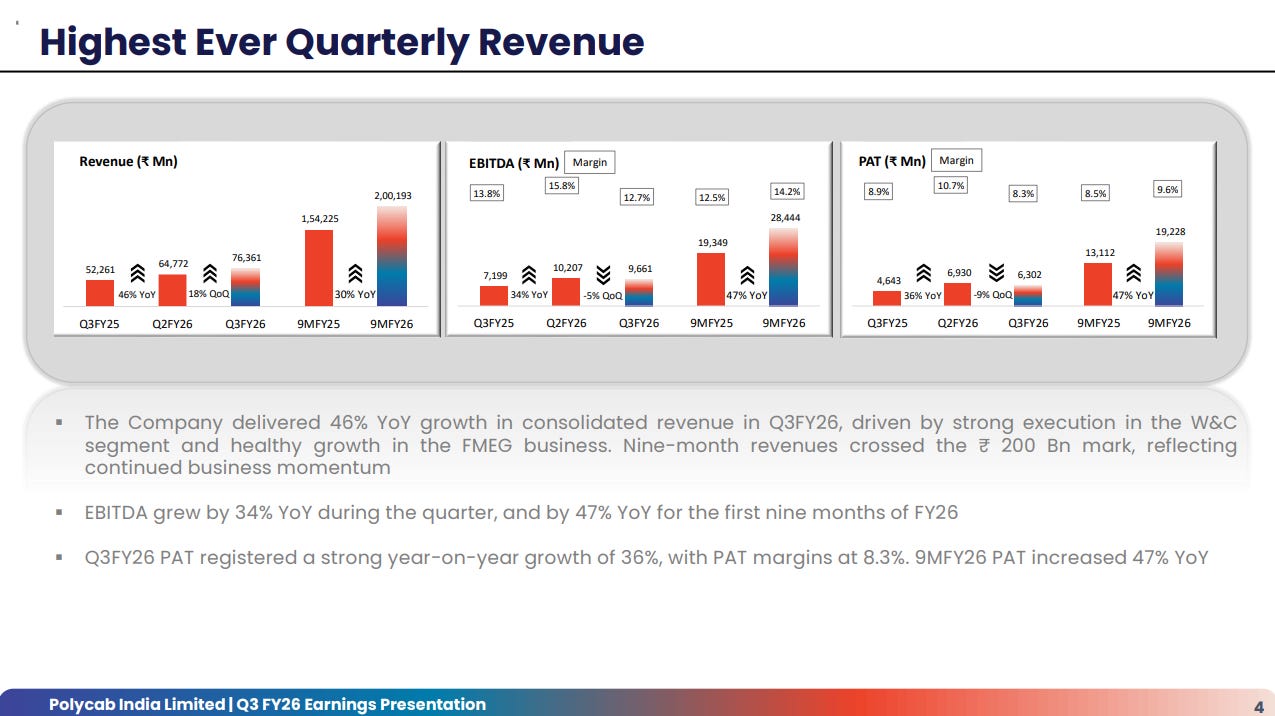
Polycab, the undisputed frontrunner, posted its highest-ever quarterly revenue at ₹7,636 crore — up a massive 46% year-on-year. The absolute net profit grew by 36% year-on-year to ₹630 crore. In a first, for the first nine months of the year, Polycab crossed the ₹200 billion revenue milestone. That EBITDA margin of 12.7% was a touch lower than 13.8% in the same quarter last year — we’ll get to why that is.
KEI Industries grew revenue 19.5% to ~₹2,954 crore. The absolute net profit surged by 42.5% to ₹235 crore, outpacing revenue growth comfortably. KEI’s EBITDA margins expanded to ~12%, up from 10.3% a year ago.
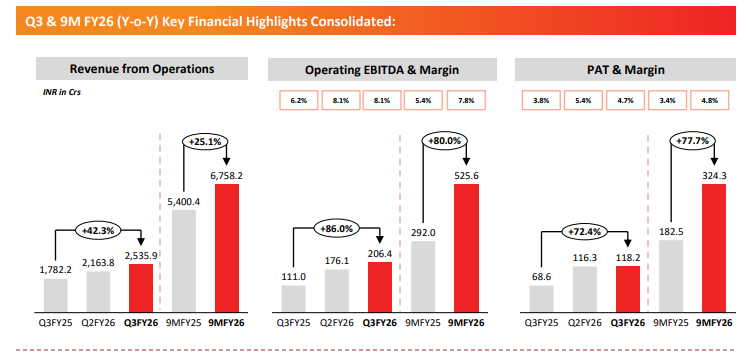
RR Kabel, the youngest of the three companies, delivered what might be its most impressive quarter yet. Revenue jumped by 42.3% to ₹2,536 crore, hitting an all-time high not just in the quarter, but also in the fiscal year so far — just like Polycab. Meanwhile, the profit-after tax shot up by over 70% to ₹118 crore. Compared to last year, its EBITDA margin expanded by 1.91 percentage points to 8.1%.
All three improved significantly from Q2, which faces more seasonal demand due to the monsoons. The second half of the year is generally stronger than the first, as many real estate projects kick-off or restart activity in this time.
But that alone doesn’t explain the all-time high performance achieved in many aspects this quarter.
A tale of scale
The most important reason for why revenues and profits have risen to record-highs is economies of scale.
Nothing improves margins like when you begin to use more of the factory capacity you’ve just invested in. Volume production rises, and the fixed costs of running the factory get spread over a much larger volume of output. This lowers the per unit costs, and the extra revenue flows almost directly to the bottom line.
In our previous coverage, we highlighted how W&C companies have been incurring lots of capex early on to meet the increasing future demand for their products. Much of this capacity is also dedicated to more high-value products within the W&C category. And this capex streak will continue into the next few years.
For instance, take Polycab, which has been investing aggressively under its multi-year capex program. This quarter, it began reaping the payoff of its efforts to build ahead of demand so far. Its capacity utilization had climbed to the early 80% range, up from 70% just a few quarters ago. When the order surge came, Polycab had the capacity ready to capture it.
RR Kabel was in a similar position. Just last quarter, its wire capacity still had headroom at 70% utilization, while its cable lines were running hot at 90-95%. This quarter, the combination of available capacity and surging demand helped in a near-doubling of the EBITDA.
KEI, on the other hand, has actually maxed out its cable manufacturing capacity, with utilization already at peak levels. As a result, KEI could only grow cable volumes by about 10%, while Polycab and RR Kabel were growing far faster.
But that doesn’t mean they aren’t taking capacity expansions seriously. In December, KEI started operations in its newly-commissioned plant in Sanand, Gujarat — one of its largest investments ever. While it didn’t contribute meaningfully to Q3 production, we might just see its effects from next quarter on.
Wires over cables?
Interestingly, the Q3 results also represented what looks like a break from the story unfolding in the last few quarters.
In Q1 and Q2, cables had been outperforming wires because infrastructure projects requiring heavy-duty cables have been the primary growth engine. But in Q3, that trend flipped. Wires grew faster than cables across all three companies.
As we’ve covered before, house wires tend to be more profitable than cables. That’s because they’re brand-driven B2C products that are sold through retailers. Cables, though, are often sold institutionally through competitive tenders. So, this shift in sales mix toward wires is partly what helped margins improve.
Why did wires do so well? The reason boils down to the fundamental raw material that the industry uses, as well as the biggest cost item in making wires and cables: copper.
The copper shortage
You probably know by now that globally, copper supply is very tight. Between September and December 2025, copper prices rose about 21% in rupee terms — an unusually sharp spike over just one quarter, which, of course, would eventually make the price of the final product more expensive.
Seeing this, the distributors of wires & cables did the rational thing: stock up the product in bulk while it was still cheap.
Each company has observed a pre-stocking effect among its distributor network, that too almost wholly in wires rather than cables. Why is that? Well, that’s both due to the product difference in wires and cables, and how they’re sold.
For one, wires are relatively smaller and more lightweight than cables, and hence can be stored in bulk far more easily. Secondly, wires are primarily sold through retail networks, and therefore have predictable demand. The demand for cables, though, comes from institutions (like real estate companies), and hence depends on the project being executed, making hoarding more difficult. And lastly, cables are more expensive than wires.
If you strip this effect out, though, cables likely still grew faster than wires, in line with the structural trend that has unfolded so far. But is this effect temporary? Ideally, it should be. Polycab’s management has indicated that this isn’t the first time this has happened, and believes that this issue will be short-lived.
Pricing is a tricky game
The copper story isn’t entirely about stocking early, nor is it entirely about better margins. It’s also about how different companies chose to handle the price increases, even sacrificing margins to do so.
Polycab made a deliberate choice not to pass on the cumulative copper inflation over the year by hiking prices in one sudden go. Instead, they passed them in a staggered manner over time. They also absorbed part of the cost increases. This compressed their margins, but that was compensated for by the increase in operating leverage.
But sacrificing margins had a benefit — it increased volume sales for Polycab. They highlighted that their strategy earned them more trust from their customers. In a category where the main product is quite commoditized, this trust is invaluable and will keep feeding into itself over time.
KEI, meanwhile, took the opposite approach. They revised list prices every 15 days, passing on virtually all of the copper cost increase to customers with little time lag. This, perhaps, is why their margins were stronger, but their volume growth considerably lower than Polycab and RR Kabel.
RR Kabel falls somewhere in between. They pass through most of the inflation, but with a longer lag than KEI. This hurts their margins a little. But like Polycab, the sheer scale of their volume growth meant operating leverage overwhelmed the minor cost pressure.
Selling to the world
Even in the age of tariffs and trade wars, somehow, W&C companies are making bank through exports, which generally earn fatter margins than domestic sales.
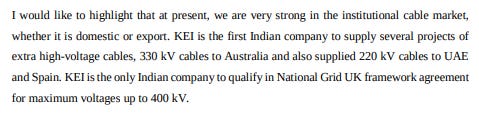
KEI was the standout performer here. Its export sales nearly doubled to ₹544 crore. The remarkable thing is that KEI achieved this growth despite putting the US market on hold because of tariff uncertainty. Instead, they pivoted aggressively to other regulated markets, like Australia, Europe, and the Middle East.
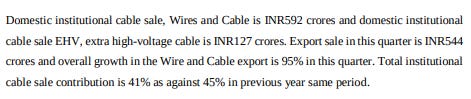
What kinds of products get sold to foreign countries? It turns out that these are mostly extra high-voltage cables, which are complex to make, and therefore higher-value than standard wires. The margins earned via exports are high partly because of the nature of the products being sold outside.
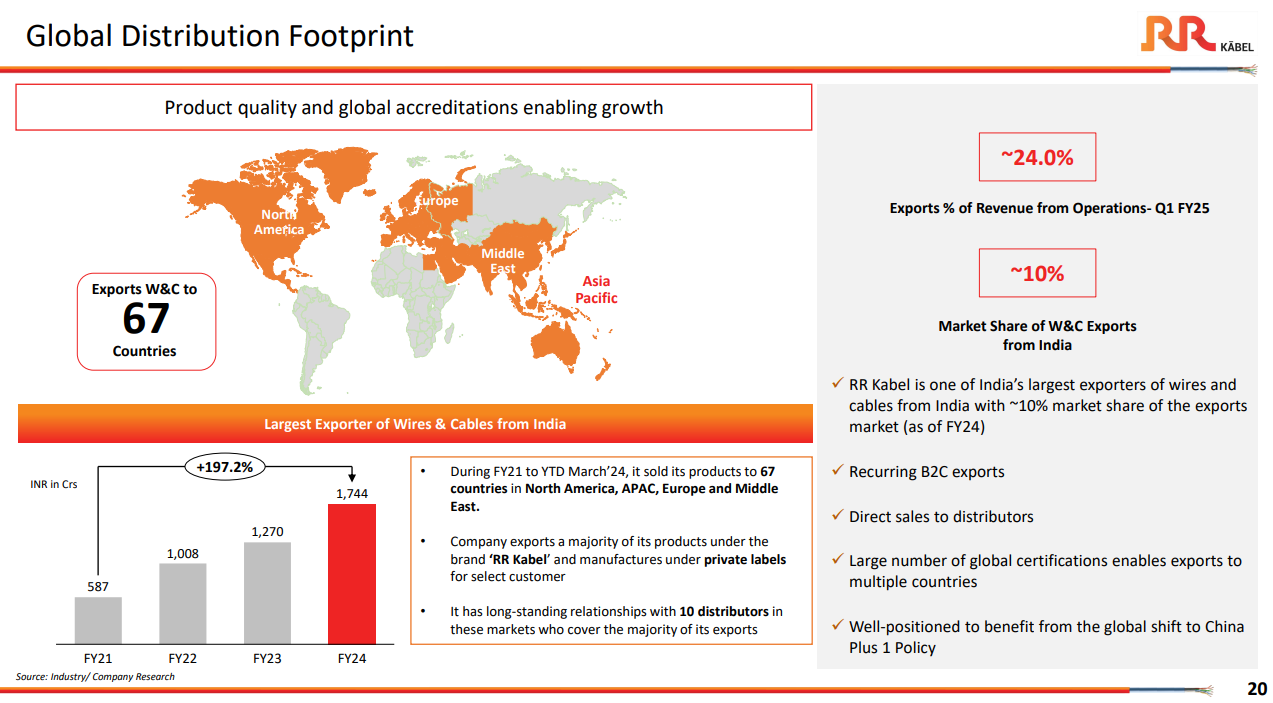
For RR Kabel, exports make up more than a quarter of their revenue — a far bigger share than KEI or Polycab. By their own admission, they’re one of India’s biggest exporters of wires & cables. While not disclosing any figures this quarter, they have indeed attributed part of their success this quarter to exports.
Polycab’s international business, however, has been relatively flat this year. However, that might largely be due to base effects — after all, they’re twice the size of KEI. In the same quarter last year, Polycab’s exports grew by a whopping 62% year-on-year.
However, exports have been declining as a share of Polycab’s revenue mix. This, perhaps, might also be because of the fact that the US still makes up their largest source of demand, making up 20% of exports. This quarter, they’ve admitted as much that US tariffs continue to be an overhang on their international business.

Interestingly, there has been a tone shift in how Polycab perceives the US market now. In Q3 FY25, Polycab was far more confident that they had secured most of the permissions necessary to sell freely in the US.

What comes next
The W&C industry is riding a genuine structural upcycle, powered by infrastructure spending, real estate, renewables, and an export market that’s diversifying smartly around tariff barriers. Companies that invested in capacity early are reaping outsized rewards, and their own capex cycle isn’t over yet.
Yet, the problems never go away, they’re just kept at bay. The copper shortage is affecting not just W&C, but many other industries wholesale. This may not be a structural shift in the industry — pre-stocking due to raw material inflation has indeed happened before. But how long the tightness of copper supply lasts will be a key determinant of the future of this industry.
All said and done, the demand story is robustly tied to India’s growth. As RR Kabel’s management put it, the W&C industry structurally grows at twice India’s GDP growth rate. If that holds, and India grows at 7-8%, the industry as a whole is looking at 14-15% annual expansion.
Tidbits
RBI tightens exit rules for small NBFCs
The RBI has proposed stricter rules for de-registering Type-1 NBFCs with assets under ₹1,000 crore. Firms must prove for three years that they did not use public funds or deal directly with customers. Even promoter loans will count as public funds, making exits much harder.
Source: The Hindu BusinessLineIndia mandates three-hour social media takedowns
India has cut the deadline for social media platforms to remove unlawful content from 36 hours to just three hours. The new rule takes effect February 20 and adds pressure on firms like Meta, YouTube and X. Critics say the timeline is unrealistic and raises censorship concerns.
Source: ReutersHappiest Minds to double AI hiring amid talent crunch
Happiest Minds plans to double its AI and GenAI workforce to over 1,000 as skill shortages are costing it revenue. The company will invest more and focus on experienced hires to meet demand. AI is becoming central to client conversations, not just an add-on service.
Source: Business Standard
- This edition of the newsletter was written by Kashish and Manie
Tired of trying to predict the next miracle? Just track the market cheaply instead.
It isn’t our style to use this newsletter to sell you on something, but we’re going to make an exception; this just makes sense.
Many people ask us how to start their investment journey. Perhaps the easiest, most sensible way of doing so is to invest in low-cost index mutual funds. These aren’t meant to perform magic, but that’s the point. They just follow the market’s trajectory as cheaply and cleanly as possible. You get to partake in the market’s growth without paying through your nose in fees. That’s as good a deal as you’ll get.
Curious? Head on over to Coin by Zerodha to start investing. And if you don’t know where to put your money, we’re making it easy with simple-to-understand index funds from our own AMC.
Thank you for reading. Do share this with your friends and make them as smart as you are 😉
If PSBs want to capture more of retail segment, then they need to improve their digital infrastructure (net banking /mobile banking etc). Some of the public banks' websites are downright laggy and bloated. Further, they need to make better use of capital and also strive to lend to the MSMEs more so that the lower strata can rise across the value chain eventually.
Hi, I have been following daily brief for quite could you suggest some sources or tools for research as it is very hard to keep track of the updating information coming out. ( it might be my laziness but anything that would help)
Thank you
P.S. - love your content and what you guys are doing