
Sizing up the GLP race


Our goal with The Daily Brief is to simplify the biggest stories in the Indian markets and help you understand what they mean. We won’t just tell you what happened, but why and how, too. We do this show in both formats: video and audio. This piece curates the stories that we talk about.
You can listen to the podcast on Spotify, Apple Podcasts, or wherever you get your podcasts and watch the videos on YouTube. You can also watch The Daily Brief in Hindi.
In today’s edition of The Daily Brief:
Exploring the starting line for the GLP-1 race
Is Indian industry hidden behind a statistical quirk?
Exploring the starting line for the GLP-1 race
Over the past few months, Indian pharma companies have been unusually chatty in their earnings calls about their GLP-1 plans. And that’s for good reason. They're all lining up to have a crack at one of the biggest market opportunities in pharmaceutical history.
We've been tracking GLP-1 for a while now: it is, quite clearly, a remarkable invention. For quick context, GLP-1 drugs like semaglutide promise something that might have seemed too good to be true just five years ago: they help you shed weight. They re-wire your brain's relationship with food, reducing the unhealthy cravings you feel. They help you fight temptation — perhaps the biggest barrier in anyone’s weight loss journey. That’s a miracle; and thus, multi-billion market.
But as we covered previously, in a cruel twist of fate, Novo Nordisk realised the miraculous potential of what it had created far too late. It had a ~20 year patent over the drug; and for most of that time, it thought it was selling really good diabetes medicine. It was only in 2021, five years before its patent ended in much of the world, that it realised what a goldmine it was sitting on.
That clock has nearly run out, now. Its semaglutide patent expires in early 2026. And it’s clear that anyone that can make a knock-off will do so. Take the United States: under US law, “compounding pharmacies” can make copycat versions of a patented drug, as long as they don’t mass produce it. And recently, Novo Nordisk lost an estimated 1 million patients to these compounding pharmacies.

This unexpected competition has forced Novo Nordisk to cut its 2025 revenue forecasts.
Individual pharmacies, though, are hardly the biggest concern. With the patent cliff just months away, bigger players are eyeing the market. Novo Nordisk is already trying hard to fend them off in court. But the opportunity is enormous — this is a drug with tens of billions in sales potential, and Novo's stranglehold might soon slip.
Is it any surprise that India, a country where many have made fortunes selling generic versions of drugs, is eyeing this potential with glee?
The difficulty of the Semaglutide supply chain
Before we get into what these companies are saying, it's crucial to understand what they're actually dealing with. Because semaglutide isn't a simple pill. It’s a horrifyingly complex molecule with nearly six hundred atoms:

The standard drugs you’ve heard of, like Aspirin, look comically simple in comparison:

Making Semaglutide, in short, is orders of magnitude more difficult than a lot of generics you see. It requires sophisticated processes like “peptide synthesis” and complex drug-device combinations. That complexity naturally limits how many players can even show up. As the patent on Semaglutide expires, don’t expect a simple, straightforward path to mass-production. This is a supply chain with many moving parts, and companies are still figuring out how to put them together.
As OneSource Specialty, an Indian CDMO that supplies multiple companies, noted:
“...our guess is these are complex products. So we don't expect the market to be crowded as when the market gets formed.”
What does this complexity mean for the industry?
For one, at least early on, making Semaglutide will be a team effort, with room for different companies to play different roles.
If you have the technical ability to enter this complex market, that’s an incredible opportunity. Many drug companies are willing to lay out the red carpet for you. To OneSource, for instance, demand looks far stronger than they first estimated:
“...all of our customers who are going to be launching the product as the markets open up later this fiscal, have actually raised and revised their forecast upwards, in fact, which is very conducive.”
The demand looks so good, in fact, that they’re confident enough to offer “take-or-pay contracts” — where they promise to pay up even if they don’t take delivery of something. That has allowed OneSource to invest in more capacity:
“And the fact that all these contracts are supported by take or pay, this really reinforces our confidence in the trajectory ahead and basis that we are actually accelerating our Phase 2 of capacity expansion in drug device combinations.”
Perhaps the most complex part of the chain is coming up with the “active pharmaceutical ingredient‘, or ‘API’. But that isn’t the only part of the value chain where money can be made. Once that is done, it still has to be turned into a usable medicine. That API is mixed into a stable solution, put into tiny sterile containers, and finally built into an injection device that a patient can actually use. The final product looks like this nice, simple pen:

That is a business proposition of its own.
Dr. Reddy's, for instance, is racing to set up an end-to-end supply chain of its own. But for now, it seems, the company can only make APIs. It’s entrusting the work of turning those APIs into a final product to a partner. As its management said:
“So, the launches that will happen in FY26 and FY27 will not be out of Vizag. It will be with our partner. And using our API, but with the partner. Which means that the capacity of FTO-11 will come from FY28 onwards. We are likely to have, in the beginning, with our partner, about 12 million pens in FY27. And if you like to look at calendar 26, because it's very relevant for the potential Canadian launch, it's about 10 million pens. This is what we are planning to have”
Cipla, meanwhile, is trying a little bit of everything. It’s improvising on the go, plugging into whichever link — API, device, or finished product — that gets them to market the fastest.
“So we are playing a mix and hybrid strategy at places we are filing -- at places we have our own product as well as we've also got a product from partners value chain as well. So we're trying to maximize the opportunity in total between trying to manage our own supply chain, partner supply chain, supply chains of others as well as even taking a hard look at GLP-1 as a category as against just a single product that would launch in the near future.”
The industry, in a sense, is trying to make sense of how to capture this market as soon as the race begins. If they vertically integrate, they could see better margins and supply control. But the race is hot, and there’s no guarantee that they can put everything together in time. Partnership models offer speed and flexibility — and at the moment, companies may compromise with lower margins and less control — just to get to the market.
Indian companies are hunting for an angle
That said, Indian companies aren’t just asking where they can fit into the game of copying Semaglutide. Instead, they’re trying to find their own angle into the business. Here is some of what they’re considering:
GLP-1 is more than just semaglutide
For one, GLP-1 drugs are a huge category — and a drug like Semaglutide is just one variant. To a pharmaceutical company, this isn’t one new drug, but an entire portfolio that they hope to master. Take Dr. Reddy's CEO:
“The full portfolio of GLP-1 for the company is 26 products. Obviously, semaglutide as well as the Eli Lilly product will be the biggest, and we are trying to get for each one of them to be first to market, as well as to create some differentiated play. So, it will evolve.”
Cipla thinks so as well:
“...for us, the entire GLP-1 category is more important than just looking at individual products within that, right?”
In fact, the company sees the space as a portfolio, with the choices in your portfolio determining your future success.

This makes sense to us.
Semaglutide is the biggest prize right now. But research is still on, and chances are that we’ll find more interesting things about these GLP-1 drugs over time. That’s why many companies are betting on a decade-long GLP-1 boom — with multiple drugs, multiple uses, and multiple ways of taking them.
Think of how the antibiotic manufacturing business was bigger than just copying penicillin. There’s a good chance GLP-1 drugs could go the same way.
Finding a niche
Some companies, in fact, are already trying to find a way to differentiate themselves in the market — everyone knows things will get crowded soon, and are already in hunt for a niche of their own.
Zydus Lifesciences, for instance, is betting on user experience. They claim to have created a “different formulation” makes the medicine more convenient for patients to use, while being cheaper.
Torrent is spreading its bets. They’re simultaneously working on injectables and oral drugs. Both have separate uses and patient pools — and Torrent is basically trying to cover as many bases as they can.
Mankind, meanwhile, is going completely off-script — experimenting with a completely new and proprietary drug. Like Semaglutide, their new drug targets obesity too, but is far smaller:
“...we are developing, which is a GPR 119 which is a novel mode of action, where we are targeting obesity. It is unlike GLP one, which are peptides and large molecules, this is a small molecule, which is targeting the GPR 119 cell in the body. So, that molecule, as we speak, is underway phase II trials in Australia. So, we should have some results in our hands by the end of this year.”
This is a massive bet. If it works, it could create a rival to Semaglutide, instead of a knock-off — with entirely different properties. What those properties are, we don’t have a clue, but this is worth following.
The trade-offs before these companies are interesting. Copy the existing stuff, and you get to market fast — but you're likely to face stiff competition, and might have to compete purely on price. Try to differentiate, and you might build something better — even a whole new rival class of drugs — but that takes years, and might not work at all.
The money is in exports
One of the most interesting strategic choices these companies will have to make is around geography. The real market opportunity, with Semaglutide generics, isn’t in India. It’s in the entire world. Which is why these companies aren't prioritizing India first — they're leading with export markets, particularly Canada and Brazil.
The data shows that foreign markets have clear demand, which nobody is currently able to fulfill. As OneSource explained, the numbers for sales in Canada and Brazil are “supply-constrained” — that is, there’s demand for Semaglutide drugs, but nobody to fulfill it. The diabetic and obesity patient population is significant and underserved. That’s a giant opportunity for Indian companies

Canada offers the clearest opportunity. Novo Nordisk's patent, there, has lapsed due to missed maintenance fees. With such a clear path ahead, Dr. Reddy's, for instance, is prioritizing whatever capacity they have to launch in Canada.
Is the market already saturated?
While Semaglutide isn’t something that any company can make, the few that can are enough to make this the site for a massive price war. At least ten Indian companies are developing semaglutide generics. And then, there’s global competition from Sandoz, Apotex, and others.
Does that make this a hopelessly saturated market already?
Not quite. See, while prices might drop, a lot more people will take these drugs. They’ll simply become much more affordable, and many people who couldn’t afford Novo Nordisk’s or Eli Lilly’s formulations might be able to afford these generics. That access will enlarge the market considerably. As OneSource put it:

The bottom line
As the Semaglutide patent runs out, we’re likely to see a massive world-wide race. Pharma companies are jostling to execute one of the most complex generic launches in history. Already, before the market has truly opened, we’re seeing a striking diversity in how companies are sizing up this opportunity. They’re trying whatever they can to get a toe-hold, experimenting with everything from supply chains to go-to-market strategies. Some are going for pure scale and speed, others for capital-light flexibility, while the most ambitious are using this cash cow to fund breakthrough innovation.
This is going to be a hotly contested race that will get very crowded, very fast. We might just be at the cusp of one of the most remarkable business wars we have seen.
Is Indian industry hidden behind a statistical quirk?
There's a truism about the Indian economy that everyone seems to know: India’s manufacturing sector has been stuck at 15-17% of GDP for decades. This gets repeated so often that it has receded into the background of any economic commentary on India. We, at The Daily Brief, routinely mention this. But it’s not just us; even sitting cabinet ministers bring it up.
This story makes it easy to feel pessimistic about our economy. We’ve thrown everything we can at the problem — subsidies, production-linked incentives, import controls, and countless other gambits — but Indian manufacturing seems stubbornly resistant to growth. The sector has such severe issues, it seems, that it might well be beyond hope.
That makes it easier to imagine that we’ve somehow “leap-frogged” from an agricultural economy to a services-oriented one, while forgetting to industrialise altogether. Some of us have become richer in this transition, but it often feels like we’re incapable of creating mass employment, like our peers in South Korea or China did.
But what if the entire narrative rests on a measurement error?
A provocative paper by economists Bishwanath Goldar and Pilu Chandra Das makes an extraordinary claim: manufacturing has actually boomed to nearly one-third of India's economy — we just don’t know how to count it.
Now, we really want to stress on this: we are not experts. We can’t tell you if this paper is correct, or misses something fundamental. It is, however, an excellent window into how one could think about such a question. It taught us how these numbers were calculated, and where problems could show up. And it brought a lot of depth to our thinking around a very complex problem.
Here’s what we learnt.
How do you count an economy?
This story involves something fundamentally boring, at least on the surface — it’s about a dry little detail in how national statistics are calculated. Understanding that little bit of trivia, however, could well change everything you think you understand about our economy.
But first, consider this: if you were to try and count the total economic output of India — every single bit of value that every one of our 1.4 billion people have created — how would you even start? How would you devise a process that captures everything, from every smartphone we assemble, to every saree we weave, to every line of code we write, to every haircut we give, and so on?
The humble-seeming “GDP growth” number you find in newspaper headlines is, in reality, a terribly complex figure, based on a mass of assumptions and estimations. Nobody actually knows the economic output of a country; everyone just takes guesses at it.
That’s what happens with manufacturing.
The government sends out an army of statisticians to collect data from factories across the country. They pick some factories as their sample, and then ask them what they paid as raw material, and the price they sold their goods at. The difference between the two is the “value” that those factories added. Building off these figures, we then extrapolate the value that manufacturing added as a whole. Simple enough.
That isn’t where it stops, though. Because, really, you aren’t trying to understand the value added that specific year — what you’re really curious about is how the value created by an economy changes between years. You want a “growth rate”. But that’s difficult, because of inflation — you might know the number of Rupees in value we added in 2025, and the amount we did in 2024, but the value of a Rupee itself changed between those two years. To compare the two is to compare apples with oranges.
What you really need is a single reference point for prices — something that can by-pass all the confusion that inflation creates.
So, you “deflate” your numbers. You take a “base year”, and assume that prices never changed after that point. Currently, we take FY 2011-12 as our base year. If prices were 100% higher than that in 2024, and 105% higher in 2025, we deflate the output for the two years by those amounts. That permits an apples-to-apples comparison of the two numbers, giving us the “real” growth the economy saw.
The “error”
But what Goldar and Das are getting at is even more complex than that. Hang on. We’re almost there.
In India, we use something called "single deflation". That is, we figure out one single “value addition” number, and then deflate the entire figure for how much inflation we’ve seen since. But that creates a new problem: the prices of different things move at different speeds.
Why does that matter?
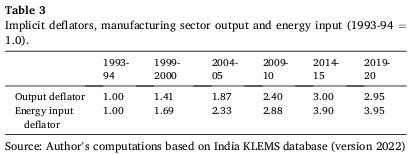
Here’s one example. You need a lot of energy to make steel. If you’re in the steel industry, the price of energy is part of your input cost, while the price you sell steel at makes your output cost. Now, consider this possibility: over the last 25 years, the price of energy went up roughly 4x. Steel, meanwhile, went up just 3x. That is, over those years, your profit margin fell.
Now, imagine a factory that made exactly the same amount of steel through all those years. The way we currently look at value added, we’d just take their current profit, deflate it, and come up with a number. As their profit margin would shrink, that number would look worse every year. But they made exactly the same amount of steel throughout! How could the value they created reduce?
Something similar actually happened in reality:
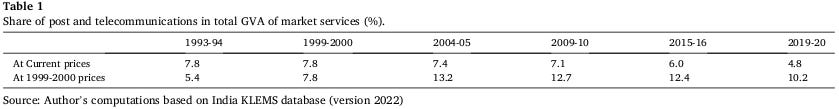
There are many such instances — where the numbers paint a picture that plainly contradicts reality. Consider, for instance, that in 1993, India’s telecom sector was ruled by STD booths and patchy PSU service. By 2020, the Jio revolution had ripped through the country, bringing hundreds of millions of people online. It’s impossible to deny that the sector boomed over those years. But as a share of our service sector, telecom actually tanked — from 7.8% to 4.8%.
See, although the Indian economy inflated as a whole, the price of a connection fell dramatically. We didn’t catch that nuance in our statistics, though. And that made a booming industry look like it collapsed.
Adjust those prices, and the truth reveals itself: in 2020, telecom was twice as important for our service industry as it was in 1994.
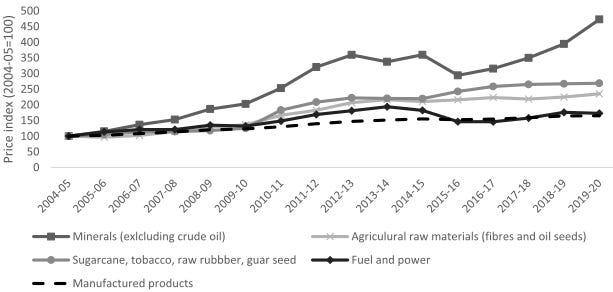
Telecom, of course, isn’t a manufacturing story. But there are similar problems across manufacturing. As Goldar and Das note, in the years since 2004-05, the price of most industrial inputs have gone up way faster than the prices they charge customers. Their profit margins, it’s likely, have fallen. But have they added less value to our economy? That’s more debatable.
When we talk about their share of manufacturing in our economy stagnating, there’s a chance that we simply didn’t count the value Indian industry has created all these years.
The solution? Count twice
Goldar and Das suggest a different way of doing things: double deflation.
Instead of deflating the overall value added, they ask that you separately deflate the cost of inputs and that of outputs — both for how those specific prices have moved. That boring statistical twist, they claim, could change the entire picture.
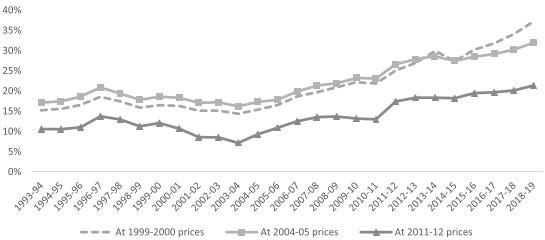
Goldar and Das do exactly that, using 2004-05 as their base year. The difference is astonishing: that small modification takes manufacturing's share from 17% of our economy in 1993-94 to an astounding 32% by 2018-19. This fundamentally re-writes our economic story.
Here’s their version: India’s economy was stagnant between 1993 and 2003. Despite the liberalisation-era reforms, it grew at a pedestrian 5.2% a year. But then, around 2003, a switch flipped. Between 2003 and 2019, the sector galloped ahead at a spectacular 10.7% a year. These were the years that global commodities boomed, value chains became much more complex, and China made its dramatic rise. We too, they claim, were part of that party.
If they’re right, India didn’t see a leap from agriculture to services over those years. Instead, we saw manufacturing and services boom together — only, because input prices escalated, while outputs grew relatively cheaper, the manufacturing growth story got hidden in the numbers.
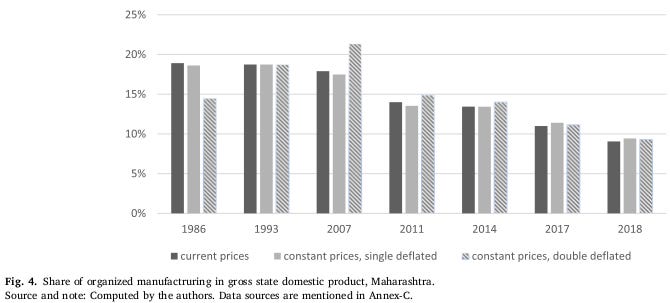
This throws a lot of other research into question. For instance, a major idea in the research is that India has seen “premature deindustrialisation”. According to Amirapu and Subramanian, India’s most industrialised state — Maharashtra — saw its industrial peak in 1986, when its per capita GDP hit US$ 1,400. Ever since, its share of industry has been falling. But if you used double deflation, according to Goldar and Das, that peak would come two decades later, in 2007, when per capita GDP was thrice as much — US$ 4,500. Other states are still getting to that point! A story of deindustrialisation, viewed a different way, turned into one of potential!
Incidentally, this idea of double deflation isn’t new at all. Most major economies — United States, Japan, Germany, South Korea — do exactly that. Emerging economies like Brazil and Mexico use this method too. It’s just that India hasn’t moved to this approach.
Too good to be true?
Now, we don’t want to overstate this case.
Since this article introduced us to all these ideas for the first time, we aren’t smart enough to critique it. But we asked Claude to tell us all the ways it might be wrong, and it gave us two major qualifiers:
One, there’s a fatal flaw to the paper: its reliance on 2004-05 as its base year. That is necessary to reach their conclusion that manufacturing is one-third of our economy. Change the base year, and that estimate changes. If 2011-12 was your base year, for instance, manufacturing would seem like ~20% of our economy — which is a lot less impressive.
Two, most of the statistical differences it points to — two-thirds, in fact — comes from a single industry: petroleum refining. Crude oil prices increased quite significantly after 2003, and when you deflate the price of inputs, our refining industry suddenly looks a lot better. What looks like a “boom” isn't broad-based industrial development creating millions of jobs and building technological capabilities. It's mostly India processing imported crude oil into petroleum products.
Those are massive caveats. And if they’re true, they seriously weaken the paper’s claim that manufacturing makes 32% of our economy.
But even Claude seems to think that they’re directionally right. Manufacturing has probably performed better than our conventional statistics suggest, even if not nearly as spectacularly as the paper claims. It points to a cruel irony, in fact: the way we count our statistics, those industries that are the most competitive — those that can run on razor thin margins and export to the world — are the very industries we undercount the most.
Most importantly, however, the paper reveals something far more subtle: the seemingly “objective” numbers we use to understand our economy aren’t objective at all. They’re made of all sorts of choices, assumptions and limitations. They point to how we count, as much as what we count.
That difference matters: everything we think we know depends on those seemingly boring choices.
Tidbits
Swiggy has quietly raised its platform fee from ₹12 to ₹14 per food order, a move aimed at improving unit economics as losses mount. In Q1 FY26, Swiggy posted a net loss of ₹1,197 crore despite 54% revenue growth, highlighting its struggle to balance scale and profitability.
Source: Business Line
JSW Steel has signed a non-binding agreement with South Korea’s POSCO to explore setting up a 6 MTPA integrated steel plant in Odisha through a 50:50 joint venture. The companies will now carry out a feasibility study to decide on investment and location, with Odisha’s strong iron ore and logistics base being a key factor.
Source: Business Standard
India has proposed slashing the GST on small petrol and diesel cars from 28% down to 18% as part of a sweeping tax reform plan under Prime Minister Modi’s latest agenda. The announcement triggered a sharp rally in auto and consumer stocks, sending the Nifty index to a three-month high.
Source: Reuters
- This edition of the newsletter was written by Krishna and Pranav
📚Join our book club
We've started a book club where we meet each week in JP Nagar, Bangalore to read and talk about books we find fascinating.
If you think you’d be serious about this and would like to join us, we'd love to have you along! Join in here.
🧑🏻💻Have you checked out The Chatter?
Every week we listen to the big Indian earnings calls—Reliance, HDFC Bank, even the smaller logistics firms—and copy the full transcripts. Then we bin the fluff and keep only the sentences that could move a share price: a surprise price hike, a cut-back on factory spending, a warning about weak monsoon sales, a hint from management on RBI liquidity. We add a quick, one-line explainer and a timestamp so you can trace the quote back to the call. The whole thing lands in your inbox as one sharp page of facts you can read in three minutes—no 40-page decks, no jargon, just the hard stuff that matters for your trades and your macro view.
Go check out The Chatter here.
Subscribe to Aftermarket Report, a newsletter where we do a quick daily wrap-up of what happened in the markets—both in India and globally.
Thank you for reading. Do share this with your friends and make them as smart as you are 😉
The Daily Brief by ZERODHA serves just not only stock investors on the upcoming businesses but also promotes the noble cause of entrepreneurship development by its Deep Research as it did earlier with Storage Batteries and today by Exploring the starting line for the GLP-1 race.These efforts to make our country better ,is an act of PATRIOTISM ,The semaglutide supply chain issues,likely generic transition,demand as well International existing cos and Indian upcoming cos have been so well covered backed by data,cos preparation etc that it’s a complete dossier of the sector and ecosystem.
I would add access to GLP1 injections drive a parallel boom: the rise of ‘natural substitutes’. Products using naturally-derived ingredients are now being marketed to support GLP1 and GIP hormone pathways. With a polished label, ‘natural’ guarantee, a moneyback promise and five-star reviews, it lures hopeful consumers towards wellness nationwide.Some substitutes, such as BRP, a natural peptide-based alternative to GLP1 drugs, are being researched upon as alternatives with less side-effects. Identified by researchers at Stanford via an AI-driven tool that sifted through thousands of potential hormone fragments, this peptide is taken from the BRINP2 protein through natural processing, and has been detected in biological samples including human cerebrospinal fluid.
The other topic whether
Is Indian industry hidden behind a statistical quirk is. Utmost importance to entire ecosystem including Govt.There are massive caveats. And if they’re true, they seriously weaken the paper’s claim that manufacturing makes 32% of our economy.
in short india is de-industrializing ,manufacturing is growing, but services is outpacing so share in gdp looks lower.