
SEBI takes down another case of stock manipulation

Our goal with The Daily Brief is to simplify the biggest stories in the Indian markets and help you understand what they mean. We won’t just tell you what happened, we’ll tell you why and how too. We do this show in both formats: video and audio. This piece curates the stories that we talk about.
You can listen to the podcast on Spotify, Apple Podcasts, or wherever you get your podcasts and watch the videos on YouTube. You can also watch The Daily Brief in Hindi.
Today is the last day for Lenskart’s IPO, and if you don’t know it already, we did talk about the business of Lenskart in one of our earlier episodes. So do check it out.
Also, tomorrow is a market holiday, and we won’t publish a Daily Brief episode as usual, but we will publish a conversation on the trend of premiumisation in the Indian markets. So do tune in tomorrow for that.
In today’s edition of The Daily Brief:
SEBI busts a stock manipulation ring
What the IEA’s latest gas report says
SEBI busts a stock manipulation ring
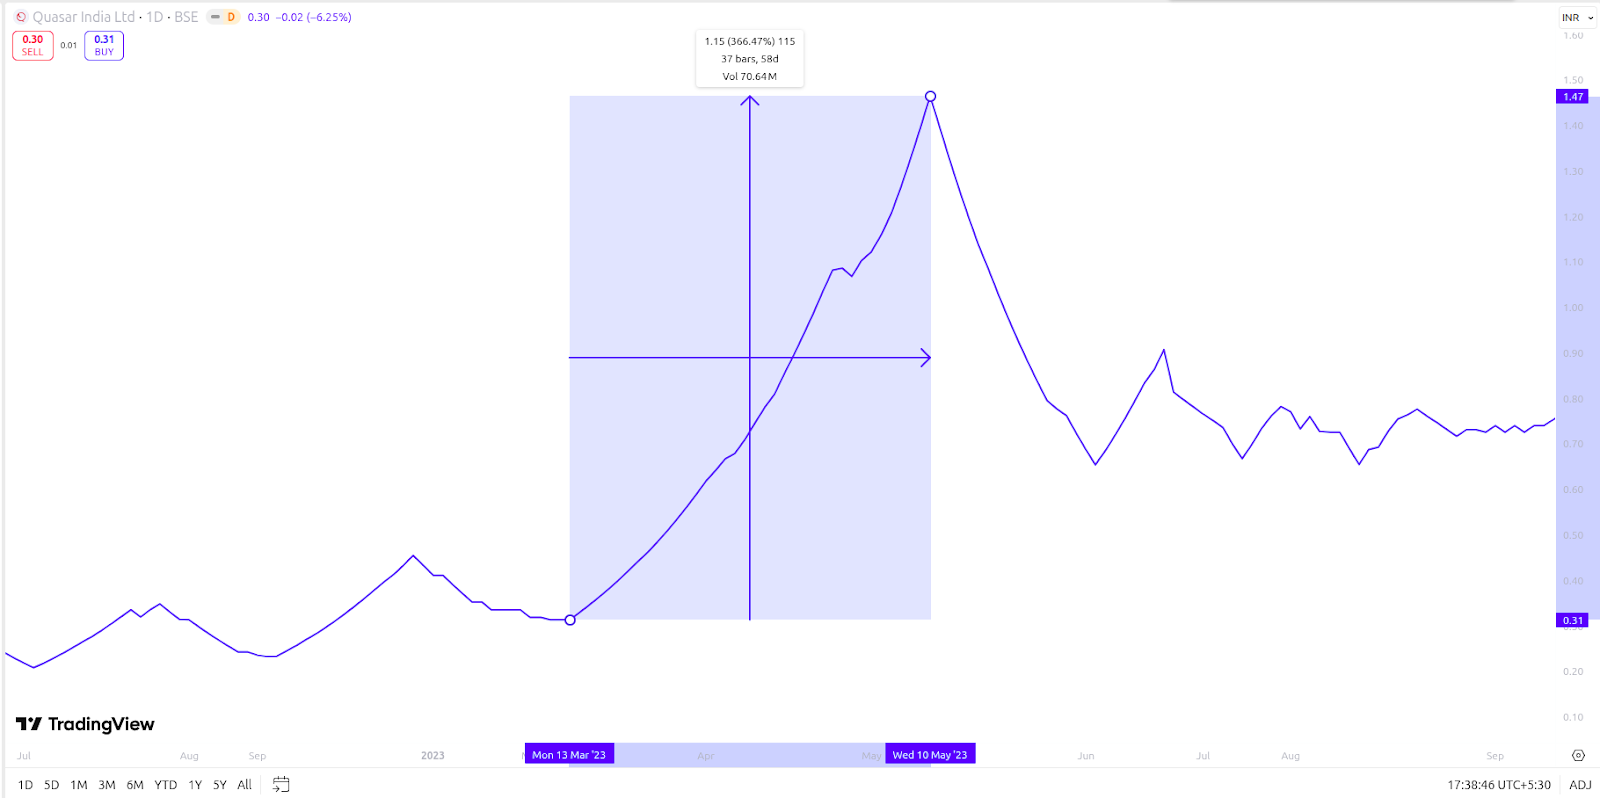
There’s a little-known trading company based in Ahmedabad, called Quasar India Limited. It’s a standard business, really — it trades and distributes commodities, particularly agricultural commodities. Nothing exciting. But it was at the heart of something odd: a couple of years ago, its shares suddenly went up ~400% in the space of two months.
Seems like a dream run, doesn’t it? If anything, it looked a little too good to be true. How did the company manage such a meteoric rise without any obvious reason? It smelled fishy to SEBI as well, who decided to investigate.
Soon, it emerged that the surge was too good to be true. SEBI uncovered that Quasar’s wild price ride was not driven by genuine investor interest – it was the handiwork of a coordinated stock manipulation scheme. In other words, some folks had rigged the game. SEBI’s latest order gives us the scoop on what happened, and how.
So, what happened?
Behind the Quasar’s meteoric rise, it turns out, a group of 20 individuals and entities were pulling the strings. They included a trading firm called Chandrima Mercantiles Ltd., along with numerous individuals with interconnected accounts. These weren’t insiders from Quasar India Ltd., to be clear — they were external operators who saw this small, seldom-traded stock as an opportunity to make a quick buck.
The whole thing played out in three “patches”.
First, in what SEBI calls “Patch 1,” a core set of 9 individuals quietly began buying up shares of Quasar from May 01, 2022 to March 09, 2023. The stock was dirt cheap back then, and was barely traded. This gave these buyers the chance to slowly soak up shares over many months.
There was such little activity, in fact, that when they traded, they would be dominant. During this phase, Quasar’s stock was only traded for 73 days. But on those days, roughly 75% of the trading volume came from just these 9 entities!
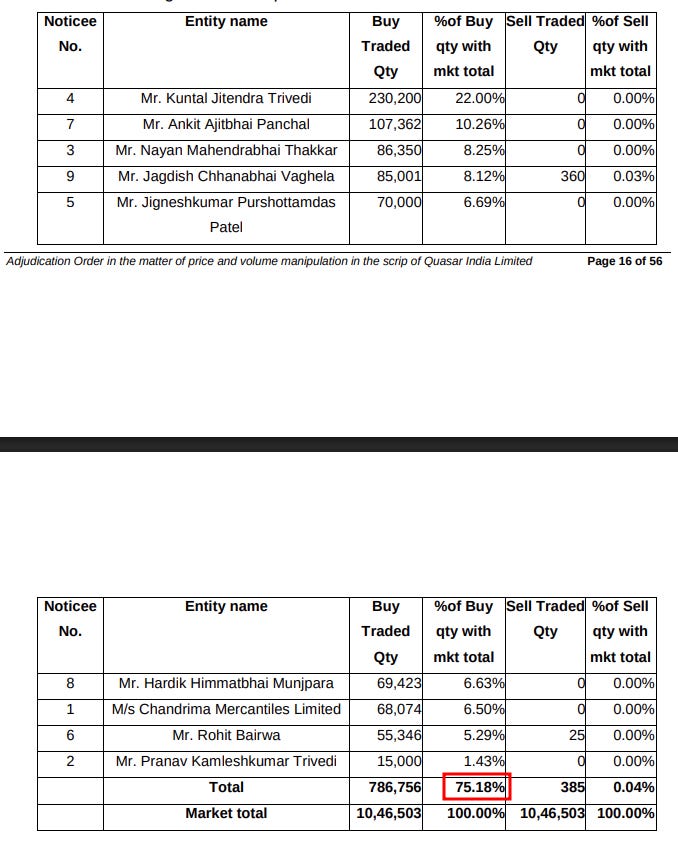
In buying so aggressively, the nine became significant shareholders of the company — with many ending up holding over 1% of the company each.
Then came Patch 2, in March 2023. This was the “pump” phase of the scheme. With their accumulated shareholding, the stage had been set for the price to shoot up. A total of 18 allied traders — the original 9, with 9 more accomplices — jumped into action. They started trading shares among themselves at steadily increasing prices.
Imagine you and I keep selling the same stock to each other, increasing the price slightly each time. We’re not really changing who owns the shares. To the outside world, however, it looks like lots of people are eagerly buying at rising prices — and the sheer churn of activity might push them to jump in as well. This is called “circular trading”, and it is illegal.
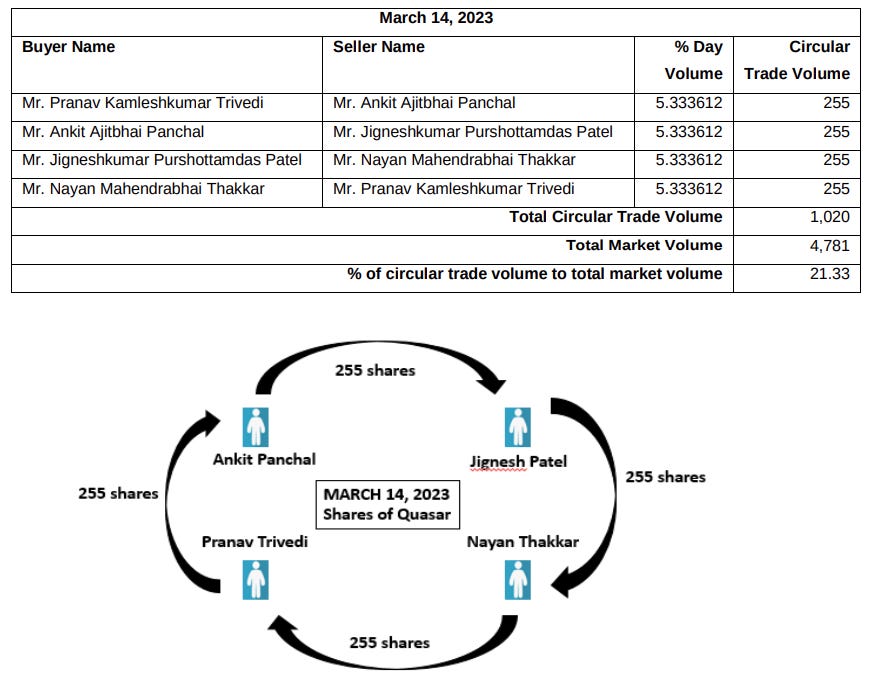
It is also precisely what this group did. On some days, the entire market volume in the stock was mostly just these players trading back-and-forth.
All this trading gave a false appearance of heavy demand for Quasar’s shares and artificially pushed the price upward. This is when the stock saw its incredible 400% rise. In just those two months, they managed to bring Quasar’s share price up from ₹8.65 to a peak of ₹42.36.
Then came the endgame, or the “dump”.
When “Patch 3” began, after May 2023, the stock was trading in the ₹30–40 range. This is when those operators started offloading their holdings to regular investors that were drawn in by its meteoric rise. This final phase would continue through the latter half of 2023. During this period, Quasar’s stock was now seemingly “hot.” It was trading nearly every day, with much higher volumes than before. Its rising price had attracted many investors. The company saw the number of its public shareholders go up by 265% by the end of December, 2023.
The manipulators kept dumping their shares on these unsuspecting traders, cashing out profits. As the selling continued, the stock price gradually slid down ~50% – from the mid-₹30s in May 2023 to about ₹19 by the end of December 2023.
By the end, the group had pocketed an estimated profit of about ₹1.96 crore from their trades.
How did they do it, and eventually got caught?
But how did this ring of traders manage to pull all of this off without being obvious? Well, they went to some lengths to cover their tracks, at least superficially:
Circular Trading
For one, they had 18 different trading accounts in different names, which were all actively buying and selling the stock. To an untrained eye, 18 separate accounts trading a stock might not scream “collusion.”
SEBI’s algorithms and investigators, however, noticed that these accounts were unusually in sync. It was almost as though they were taking turns buying and selling to each other, in a structured way. In a healthy market, you’d expect a diverse set of people buying and selling. Here, however, the same accounts seemed to simultaneously buy and sell the same stock. This looked a lot like wash trading.
Circular Flow of Funds
Another way they tried to mask the scheme was by setting up complex structures to recycle their money.
See, this sort of scheme required a lot of money to change hands between the group. But all members of the group didn’t need that cash simultaneously. They could simply rotate funds between themselves. When some of them sold shares at a profit during the pump, they could route money they received from their broker through a chain of small firms to other members of the group, giving them cash to buy more shares.
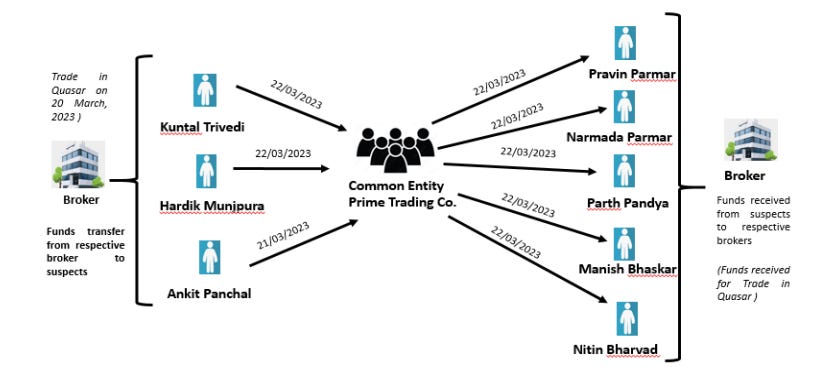
The money would travel through multiple layers, using various proprietorship firms as pass-through entities. On paper, it looked like they had legitimate business transactions with those firms. To explain the money flow, some even submitted invoices, claiming they were trading agricultural products.
But ultimately, those same funds would boomerang back into the same broker accounts, to buy more Quasar shares. Genuine investors typically don’t shuffle money in circles like this, making it another red flag.
Shared internet connection, phone calls & locations
On the surface, those behind the scheme looked like they were strangers. Some of them claimed, in fact, that they heard a rumor in the grain market that some big-shot was going to acquire Quasar, and bought the stock. That they did so together, it appeared, was a coincidence.
Only, they left subtle tech trails of their collusion.
When SEBI’s investigators followed those breadcrumbs, they discovered that one operator had a broadband internet connection which was used to operate several of the other individuals’ trading and bank accounts. That is, one person — or at the very least, a tight-knit group — was sitting at the same computer (or network) logging into multiple accounts! Those accounts, clearly, were not unconnected at all.
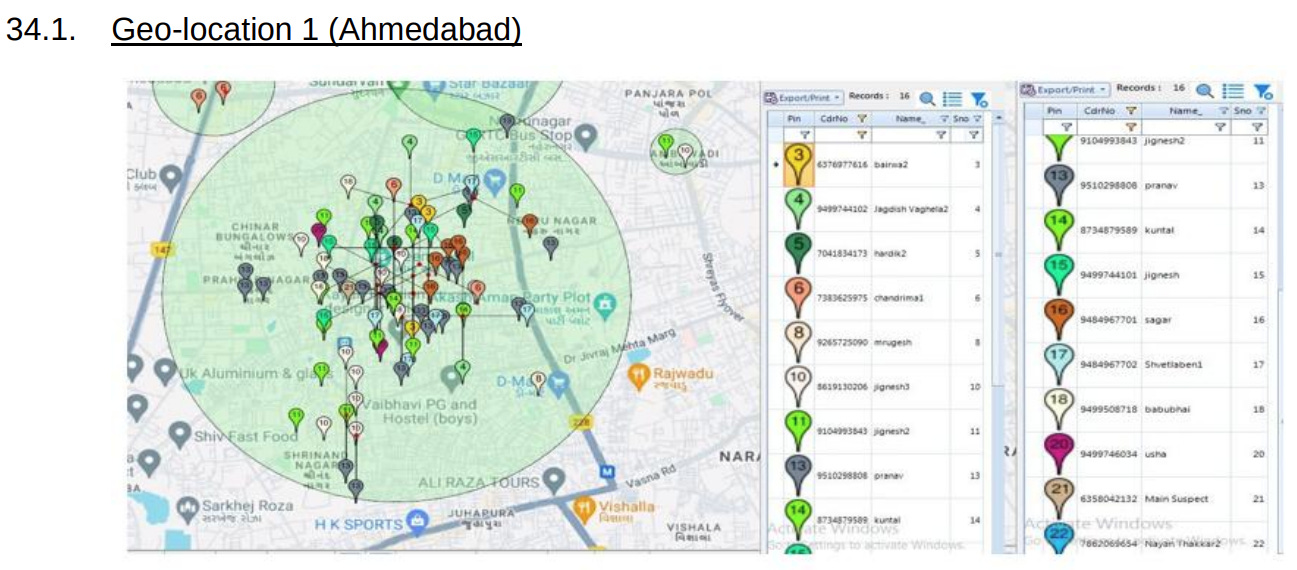
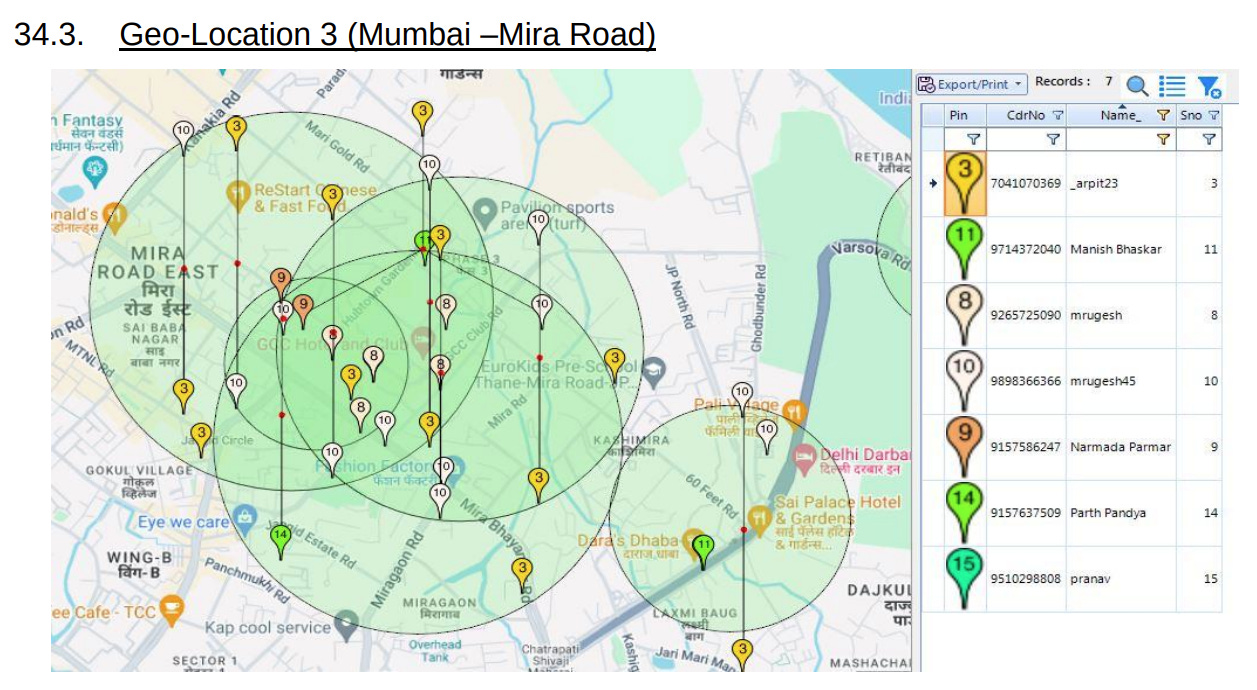
Investigators also checked phone records and cell tower data of these folks. Turns out, many of them were in frequent contact during the scheme. Moreover, their mobile location data showed they were often in the same place at the same time – including meet-ups at common locations in Ahmedabad and Mumbai. So much for being unconnected strangers!
By piecing together these clues – the trading pattern, the flow of funds, the digital trails, and the personal links – SEBI built a solid case that this was all coordinated.
The perpetrators, of course, denied it and tried to claim innocence. But the circumstantial evidence was overwhelming. It was the same people trading among themselves, moving money in loops, logging in from the same IP, calling each other, and showing up together in the same cities. Hard to call that coincidence! SEBI rightfully didn’t buy their story and proceeded to take action.
SEBI’s Crackdown & Learnings
With its investigation through, SEBI slapped a monetary penalty on the group for violating fraud and market manipulation regulations. The 18 individuals/entities directly involved in manipulating the stock were collectively fined ₹2.5 crore. On top of that, two key operators who not only helped orchestrate the scheme but also tried to hinder the investigation by ignoring SEBI’s summons – got additional fines of ₹7 lakh for their misconduct.
This case is a classic pump-and-dump — and a reminder of what to watch for.
If a little-known stock suddenly shoots up without any clear reason, be skeptical. Manipulators often spread rumors — like in Quasar’s case, where talk of a fake acquisition drew buyers in. Be especially cautious with illiquid small-caps that barely trade; they’re easy to rig because even a few people can move prices wildly. And if you see unusual trading patterns — prices rising fast while ownership barely changes — that’s a flashing red light. In short, when something looks too good to be true, it usually is.
Lastly, remember that regulators like SEBI are actively monitoring for exactly these scenarios. But enforcement usually comes after the fact, so your best protection as a retail investor is a healthy dose of skepticism and caution.
As the saying goes, if something looks too good to be true, it probably is.
What the IEA’s latest gas report says
The International Energy Agency (IEA) just released its Gas Market Report of 2025. And it suggests that today’s gas markets are very different from where they were last year.
2024 saw countries trying to recover from a shortage of liquefied natural gas (or LNG) in 2022-23. In 2025, in contrast, they’re preparing for the world’s largest-ever buildout of new LNG capacity. But this flood of new supply is arriving just as demand growth has slowed to a crawl; barely growing 1% so far in the year.
We recommend going through the report yourself for a deeper dive. But for this piece, we’ll be summarizing the key takeaways.
Let’s dive in.
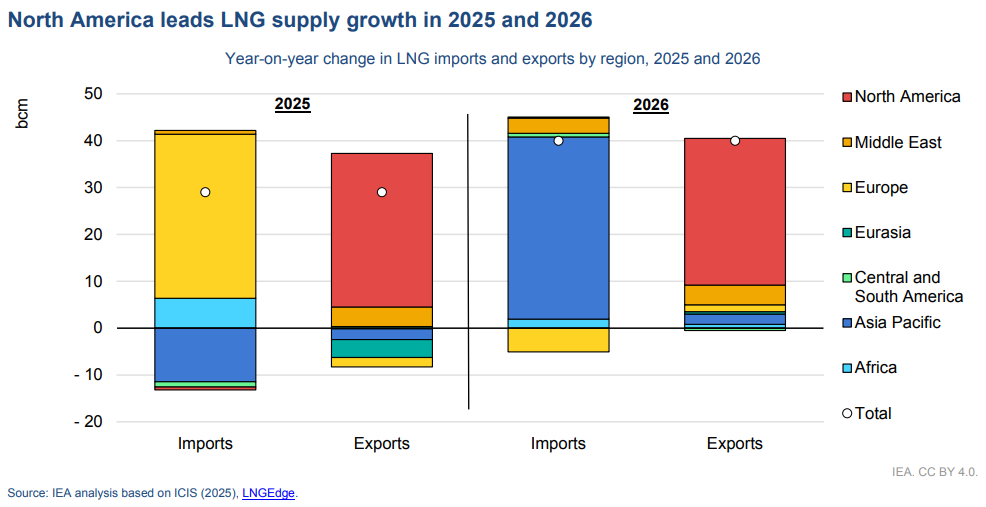
New suppliers take center stage
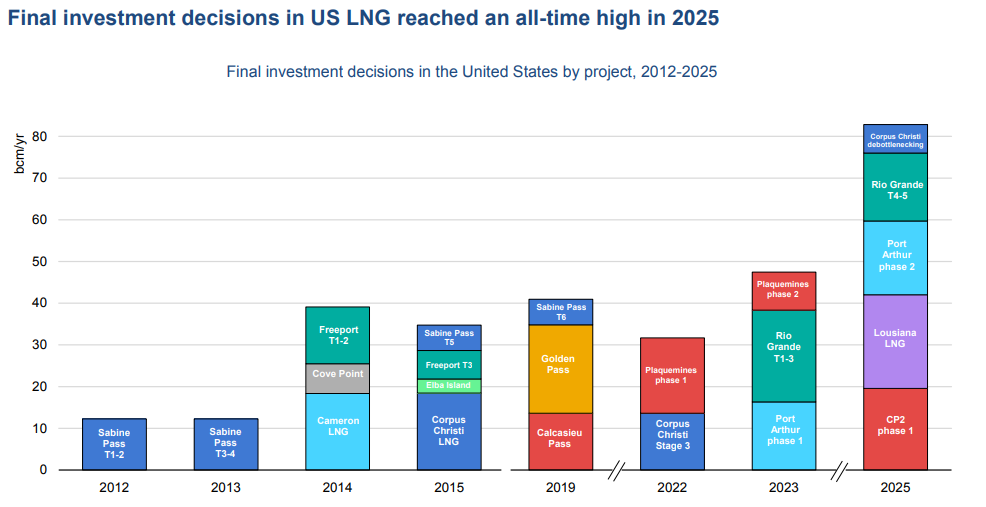
By 2030, the world will add ~300 billion cubic meters (bcm) per year of new LNG liquefaction capacity — the largest such gas buildout ever. This is driven almost entirely by only two countries: the USA and Qatar.
The US is leading the charge. In just the first nine months of 2025, American developers sanctioned over 80 bcm/yr of new capacity — an all-time record, and 70% of all LNG capacity globally in 2025. By the end of this decade, America could supply one-third of the world’s LNG, up from ~20% today.
As a result, the US has now become the price anchor for all global gas markets. Traditionally, much of LNG trade is priced based on oil benchmarks. But now, much of the world’s LNG — supplied by the US — passes through a key node in the US gas distribution network in Louisiana, called the Henry Hub. While oil-linked pricing still dominates, the world’s gas is increasingly being priced based at Henry Hub.
Just a year ago, the US was not even close to being such a global supply and pricing hub. The 2024 report of the IEA noted a long pause in U.S. project approvals. All of this change happened in the span of the last year.
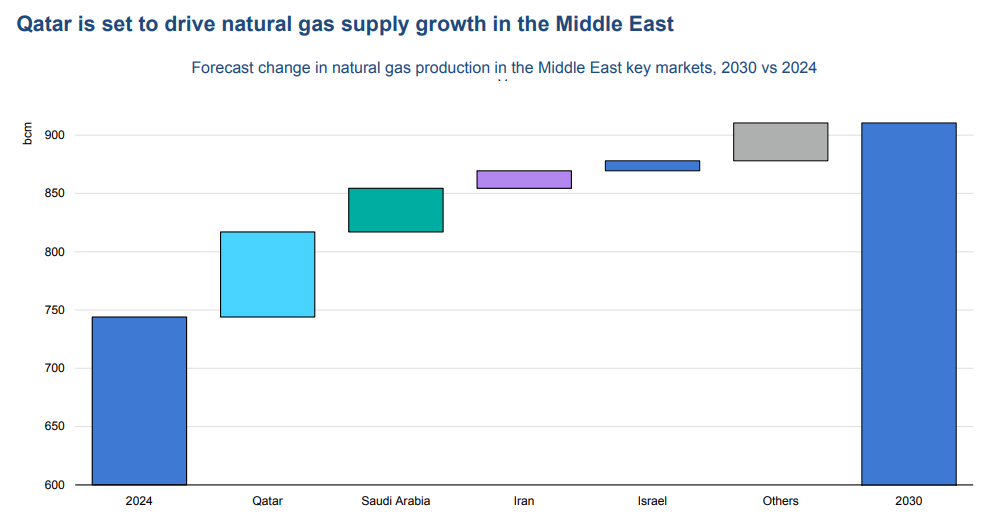
Meanwhile, Qatar — and the Middle East as a whole — is also becoming more powerful in the gas market. By 2030, the IEA expects Qatar’s exports to increase by 55%, solidifying its position as the world’s second-largest exporter of LNG. Saudi Arabia is also trying to slowly move away from oil and towards gas, having installed multiple gas plants in the past 4 years.
Israel too has joined the party. Its gas production has increased tenfold since 2009, and is expected to further increase by 30% in the next 5 years.
Russia’s role, meanwhile, has collapsed. Since the Russia-Ukraine war, Russian pipeline gas to the European Union fell 45% year-on-year in early 2025. Its total production plummeted 20% between 2022-23 — or about 125 bcm. This initially created a huge shortage, but the markets have since rebounded strongly.
But even as supply rampus up, it is hitting a market where demand isn’t growing as expected. This could create a supply glut. The IEA cautions that the world could face a surplus of about 65 bcm of LNG by 2030. That’s a complete flip from the shortages of 2022-2023.
Demand slows down — or does it?
But why hasn’t demand grown this year?
Global gas demand has been surprisingly weak in 2025. In the first three quarters, consumption increased just 0.5% year-on-year, down sharply from its 2.8% growth in 2024. And that little growth didn’t come from Asia, which usually drives increases in global demand. In 2025, oddly, growth concentrated in Europe, while Asian consumption actually remained flat.
Europe’s demand resurgence was almost entirely weather-driven. Early 2025 brought a colder-than-average winter across northern Europe, which means Europe needed more gas to power things. These weather anomalies also reduced the output of Europe’s renewable projects. Europe’s houses needed to be heated, precisely as renewable production flagged. And so, gas-fired power plants stepped in to compensate.
However, the IEA emphasizes that this increase in European demand isn’t structural, but temporary. You shouldn’t expect it to repeat again. Structurally, over the past few years, European demand for LNG has been declining. And once the weather stabilizes, the IEA expects the decline to resume. Every year, new renewable energy projects come online across Europe, reducing the need for gas-based power.
But there’s one clear structural change in the European gas market — where it imports gas from.
Europe has been deliberately reducing its reliance on Russian gas since its war with Ukraine. Russia’s share of exports to Europe fell from over 40%, in 2021, to under 10% this year. Instead, Europe has dramatically increased its gas imports from the US and even the Middle East.
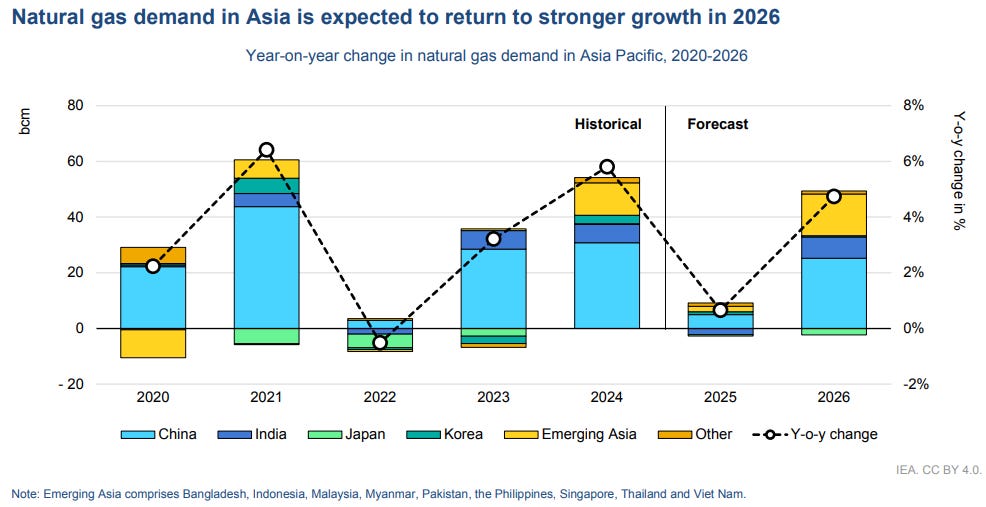
On the other hand, there is Asia, whose story is a little more concerning. Demand grew less than 1% this year — its weakest growth since 2022. High LNG prices in the first half, along with macroeconomic headwinds kept consumption in check, preventing countries like India, Pakistan, and Bangladesh from importing huge volumes. In fact, we’ve covered before why India finds it so hard to import gas.
But, much like Europe’s unique uptick, Asia’s demand pause appears temporary too. The IEA forecasts that in the next 5 years, Asia (including the Middle East) will become the center of global gas consumption. Next year, it will account for roughly half of all global demand growth, primarily driven by China and India. The new supply build-out, IEA hopes, will usher in this wave of demand by making prices attractive for Asian buyers.
But renewables will keep this growth in check. Wind, solar, and hydro energy are quickly eating into gas consumption in the power sector. In Europe, in particular, every percentage point increase in renewable generation directly translates into less gas burn.
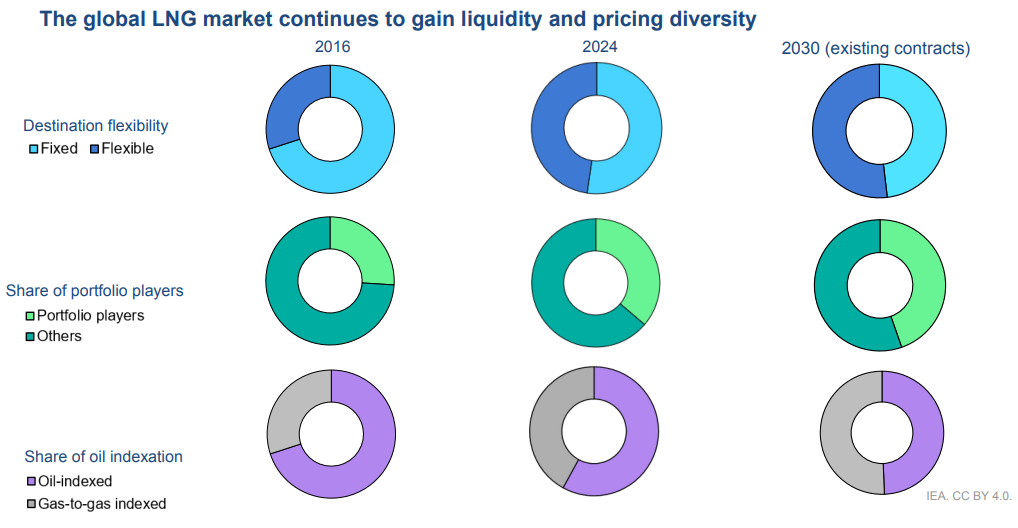
A shift in contract structures
As the dynamics of the global gas market change, there’s another change in how gas contracts are being drafted. And these have made the gas market more flexible and liquid.
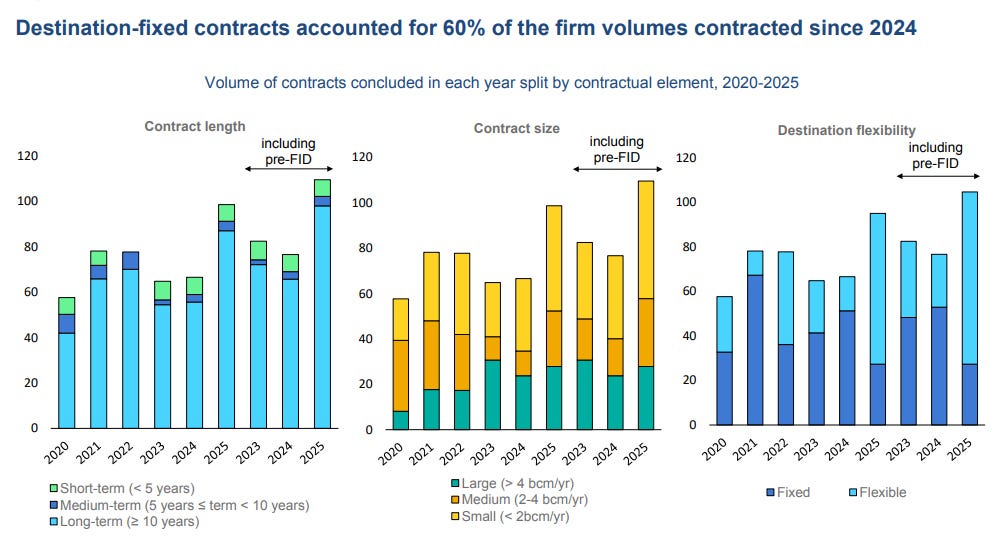
Traditionally, most LNG was traded under rigid, long-term contracts with fixed destinations and oil-indexed prices. However, now, buyers are opting for contracts with flexible prices, and more interestingly, with flexible destinations. That is, they can choose to sell the gas they’ve bought anywhere, not just one region. Between 2016 and 2024, the share of destination-free LNG contracts jumped from just 29% to 45%.
There are two main reasons for this shift.
One is the rise of American LNG exports, which are typically sold with no destination restrictions. Buyers can ship US cargoes anywhere, greatly increasing market liquidity. In fact, the gas shortage of 2022-23 demonstrated this value vividly. When Russian pipeline gas vanished, destination-free American LNG could quickly flow to Europe. More rigid contracts would have slowed that response.
A second, related, reason is the rise of middleman traders like Shell, TotalEnergies, and Trafigura. They buy from gas producers and redirect the gas where it best suits them. These portfolio players have significantly increased their market share, rising from about 26% in 2016 to over 38% in 2024, potentially reaching 44% by 2030.
Yet despite all this flexibility, the long durations of contracts continues to remain unchanged. And the reason for that is simple. A long-term contract would ensure demand for sellers and secure supply at reasonable prices for buyers, irrespective of situations of shortage or oversupply. Spot markets for gas, on the other hand, are far more prone to volatility.
The best example of this dynamic is the shortage of 2022-23. After experiencing extreme spot market volatility due to shortages, buyers rushed back to signing long-term deals. Contracts with a duration of 10 years or more accounted for 75% of volumes contracted since 2022.
In sum, the global market is trying to combine supply security (for gas buyers) with some degree of flexibility (for gas sellers) through these contracts. These two things might seem contradictory, but so far, this combination has been working.
Going green
Beyond traditional natural gas, the IEA report highlights growing low-emissions alternatives that could begin supplementing LNG. Compared to 2024 levels, the global supply of these low-emissions gases is forecast to increase 2.5x by 2030.
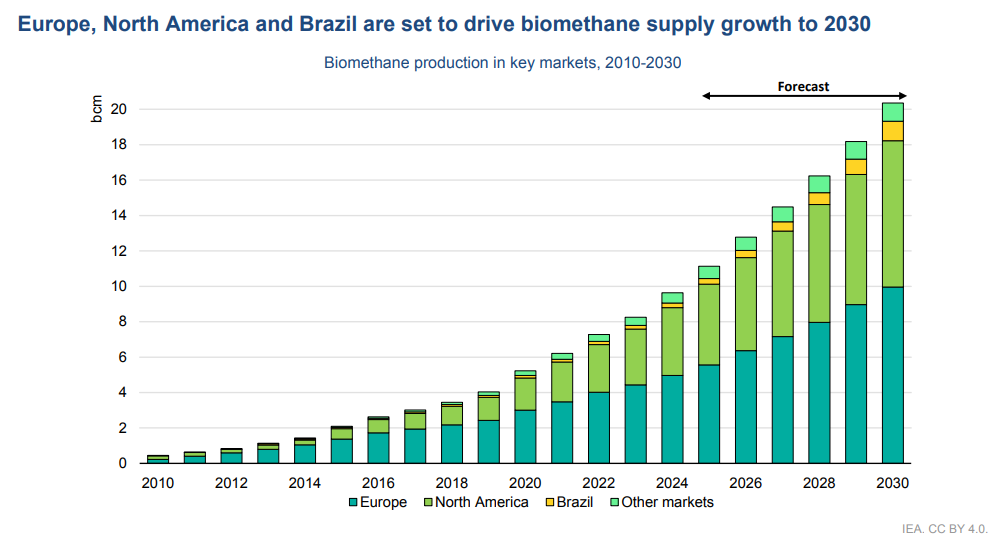
Biomethane — renewable natural gas made from biomass — is the leading alternative. Global biomethane production nearly tripled between 2018-2024, and is further expected to contribute over 50% of the increase in all low-emission gas supply. Europe is currently the largest biomethane market, producing ~5 bcm last year and expected to reach ~10 bcm by 2030. In fact, Denmark already meets ~45% of its gas demand from biomethane. The US and Brazil, the IEA notes, also have huge biomethane potential.
Even within LNG production itself, initiatives to reduce carbon content in LNG are gaining traction. Major producers are integrating “Carbon Capture, Utilization and Storage” (CCUS) across different parts of the gas value chain. Qatar, for instance, commissioned a major facility in 2019 to recover the carbon dioxide generated by processing LNG, and is expanding it rapidly.
Other green alternatives, however, are way too small to make an impact on this market, and this will most likely remain the case even in 2030. In the case of green hydrogen, for instance, we’ve covered the IEA’s earlier report on why it’s really hard to produce it on a commercial-scale.
Conclusion
What the IEA report shows is that the dynamics of the global market for LNG have become even more chaotic. Different countries are trying to adapt in their own way to these changing dynamics. And there are a myriad of reasons for it: be it actual wars, or a single country jumping to being the world’s LNG price anchor, or even the rise of renewables. It’s hard to pin it down to one structural shift.
While global gas seems to enter a new phase of abundance, it also faces various kinds of contradictions: be it demand not matching supply, or flexibility within long-term deals. We have no answers as to how the market will evolve through these contradictions, but if nothing else, it will be certainly be interesting to see.
Tidbits
Pine Labs trims IPO, targets $2.9 billion valuation
Indian fintech firm Pine Labs will launch its IPO on Nov 7, aiming for a valuation of about ₹25,400 crore ($2.9 billion) — less than half of its earlier $6 billion goal. It plans to raise ₹3,900 crore ($440 million) through new shares, with proceeds funding tech expansion and debt repayment.
Source: Reuters
GST collections rise to ₹1.96 lac crore in October
India’s GST receipts rose 5% YoY in October to ₹1.96 lac crore, boosted by festive spending and better compliance. Net of refunds, the government collected ₹1.69 lac crore, with tax cuts on goods like shampoos and small cars expected to reflect next month.
Source: Reuters
Coal India output slips nearly 10% in October
Coal India’s production fell 9.8% YoY to 56.4 million tonnes in October amid weak demand and post-monsoon disruptions. Offtake declined 5.9%, while cumulative April–October output was down 4.5%. The company also appointed Sanoj Kumar Jha as interim CMD.
Source: Times of India
- This edition of the newsletter was written by Kashish and Manie
We’re now on Reddit!
We love engaging with the perspectives of readers like you. So we asked ourselves - why not make a proper free-for-all forum where people can engage with us and each other? And what’s a better, nerdier place to do that than Reddit?
So, do join us on the subreddit, chat all things markets and finance, tell us what you like about our content and where we can improve! Here’s the link — alternatively, you can search r/marketsbyzerodha on Reddit.
See you there!
Every week, we listen to the big Indian earnings calls—Reliance, HDFC Bank, even the smaller logistics firms—and copy the full transcripts. Then we bin the fluff and keep only the sentences that could move a share price: a surprise price hike, a cut-back on factory spending, a warning about weak monsoon sales, a hint from management on RBI liquidity. We add a quick, one-line explainer and a timestamp so you can trace the quote back to the call. The whole thing lands in your inbox as one sharp page of facts you can read in three minutes—no 40-page decks, no jargon, just the hard stuff that matters for your trades and your macro view.
Go check out The Chatter here.
Subscribe to Aftermarket Report, a newsletter where we do a quick daily wrap-up of what happened in the markets—both in India and globally.
Thank you for reading. Do share this with your friends and make them as smart as you are 😉
Great article.. SEBI is GOAT in this things now...
Nice write-up on SEBI crackdown on stock manipulations / circular trading. The entire narration felt like I was reading some detective story!