Hello and welcome to Beyond the Charts! A newsletter where we dive into fascinating charts from the world of finance and the economy, breaking down what’s happening in a way that’s easy to understand.
This post might break in your inbox. You can read it on web browser of your device by clicking here.
If you prefer watching video instead of reading, you can watch it here.
October meltdown
October was a tough month for Indian markets. The Nifty and Sensex, India’s main indices, fell about 6%. That might feel big because, since 2020, we’ve gotten used to a steady climb. Now, even a small dip feels like a major shift.
To put it in perspective, the Nifty 50’s 6.2% drop in October was the largest since March 2020.
The Mid and Smallcap indices saw a similar trend, although Smallcaps were down by only around 3.6%. Despite October’s dip, the markets have still shown strong overall growth. The Nifty is up over 11% for the year, and both the Mid and Smallcap indices have climbed more than 20%.
But as we mentioned, this isn’t even the Nifty’s worst monthly drop. It just feels that way because of the steady climb since March 2020. We all wish the good times would last forever, but that’s rarely how the market works.
Here’s an interesting chart shared by Anoop from Capitalmind on Twitter. October's 6% drop is the first of its kind in over four and a half years or 54 months. That’s why the dip feels more intense than it actually is.
Let’s look beyond the headline indices for a clearer picture of what’s happening beneath the surface. Sectoral indices paint a concerning story: every sector ended October in the red, with major losses in key industries. Auto, Oil & Gas, and Consumer Durables were hit hardest, each dropping over 10% for the month.
Market weakness also showed in the number of stocks reaching new peaks. In October, only 242 stocks hit 52-week highs, well below the usual monthly average of around 310.
The Advance-Decline ratio offers another key market signal by comparing rising and falling stocks. A ratio above 1 means more stocks are gaining, while below 1 shows more are declining. October's ratio was 1.18, suggesting that despite overall market weakness, more individual stocks actually moved higher than lower during the month.
Let’s look at two key technical indicators: the 100-day and 200-day moving averages, which give a quick sense of market trends. The 100-day average reflects medium-term momentum, while the 200-day shows the longer-term trend.
When stocks trade above these averages, it’s generally seen as “bullish,” while trading below can signal potential weakness or a “bearish” trend.
In October, fewer Nifty 50 stocks traded above both their 100-day and 200-day moving averages, indicating a clear drop in market momentum and breadth.
When we zoom out to the broader market using the Nifty 500, the situation looks even more concerning. Only about 280 stocks are trading above their 200-day moving average—a steep decline from recent months when around 400 stocks held this positive trend.
The medium-term trend is even bleaker: only 170 Nifty 500 stocks are above their 100-day moving average, down sharply from the usual 300.
So, while headline indices might not look too alarming, they’re hiding considerable weakness. Individual stocks, especially in the mid, small, and microcap segments that saw sharp gains this year, are clearly struggling more than the broader market suggests.
So, why did the markets fall? Several factors are at play:
Firstly, Foreign Institutional Investors (FIIs) shifted focus back to China, leading to record outflows from Indian markets. In October, FIIs withdrew over ₹1 lakh crore—the largest monthly outflow India has ever seen.
Second, the latest corporate earnings reveal a concerning trend. As major Indian companies report their September quarter results, many are falling short of expectations, especially considering their high valuations.
The pattern is troubling: companies have now posted weak, single-digit earnings growth for six straight quarters. Even more worrisome, earnings dropped by 3.4% this quarter—a sharp reversal from the growth seen in September 2023.

Looking at sector performance offers deeper insights into where the pain points are. Commodities have been the biggest disappointment, underperforming for nearly two years.
Other sectors are struggling too. Energy barely grew, with just a 0.1% increase in September, extending its two-year slump. IT hasn’t fared much better, with growth stuck below 10% for five straight quarters, coming in at just 6.8%.
Financial Services has slowed recently but is still showing solid growth above 17%. There are some bright spots: consumer discretionary—covering cars, media, entertainment, and real estate—rebounded with a 12.7% growth after a weak year.
Telecommunications is another success, with 15% growth over last year. This turnaround follows price hikes by major players like Jio, Airtel, and Idea, who raised prices by 10% to 27% in July.
Looking at sector profits, commodities showed a surprising turnaround. Despite a 2.4% drop in revenue, profits grew by an impressive 53.5% year-over-year, bouncing back from last year's 18% decline.
The telecommunications sector also saw strong profit growth, following a 63% increase in the June quarter with an 89% YoY rise in September. Besides commodities and telecommunications, only the IT sector managed to grow profits.
All other sectors struggled. Energy was the biggest underperformer, with profits dropping around 46%. Other sectors with moderated profit growth include FMCG, Financial Services, Healthcare, Industrials, and Services.
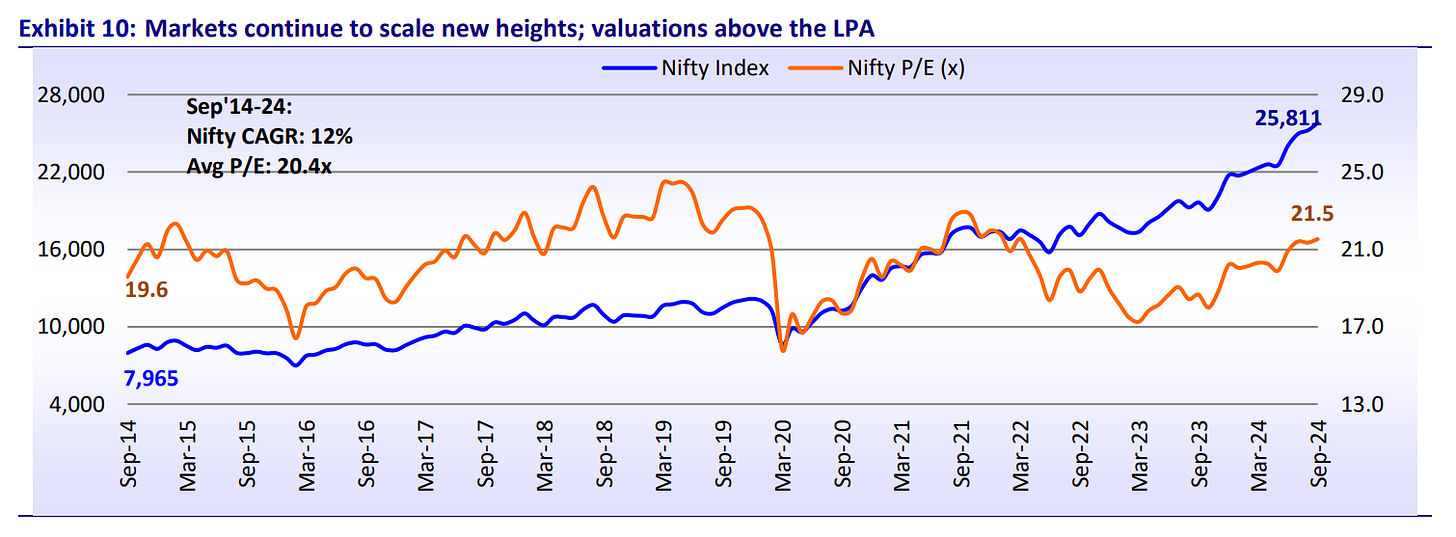
This mix of factors has understandably made investors uneasy. With Indian stocks trading at premium valuations, the big question is: can these high prices hold when earnings growth is stalling?
This gap between valuations and performance hints at a potential market correction. A recent Motilal Oswal report noted that Nifty large, mid, and small caps are all trading above their usual valuations. While valuations aren’t a reliable tool for timing the market, they suggest that high starting valuations often lead to lower future returns. However, markets can remain overvalued for quite some time.
Credit growth slowdown
Let’s dive into our next story: bank lending patterns across the economy. Each month, the RBI releases data on the "sectoral deployment of credit," showing where banks are directing their loans—whether to farmers, industries, service sectors, or individuals. This data gives us insight into which parts of the economy are attracting financing and where activity might be rising or slowing.
The latest numbers from September are fascinating. Overall bank lending grew by 14.4% year-over-year, down slightly from the 15.3% growth seen in September 2023. This slight slowdown could be an early signal of economic changes. The RBI has also been warning about the widening gap between credit growth and deposit growth. Since COVID, lending has outpaced deposits, raising liquidity concerns—a complex issue we covered in previous editions of The Daily Brief [1, 2, 3].
Agricultural credit remains fairly strong, growing at 16.4%, though it has moderated since March. This likely reflects healthy farming activity, supported by favorable monsoon conditions this year.
Industrial lending is gaining momentum, with credit growth reaching 9.1% year-over-year—a solid improvement from 6% in September 2023. This aligns with recent RBI updates noting increased investment intentions across key sectors. Capacity utilization has also risen steadily, signaling healthy demand. However, slowing urban demand remains a concern. While rural demand seems to be picking up, it’s uncertain if it can fully balance out urban declines.
When we look at lending based on company size, credit to micro and small businesses held steady in September while lending to large companies declined. However, credit to small and medium enterprises has shown strong double-digit growth, while credit to large companies has been consistently in the single digits over the past year.
Sector-wise, chemicals, food processing, petroleum, coal products, and engineering industries all experienced faster credit growth compared to last year, while metals and textiles saw a slowdown.
In the services sector, overall credit growth slowed to 15.2% from last year’s 21.6%. Yet, commercial real estate remains a bright spot, maintaining over 20% growth for eight months straight, reaching 25.5% in September. This trend aligns with our recent discussion on the strong performance of residential real estate in The Daily Brief.
When you look at consumer loans, an interesting story emerges:
Overall personal loan growth fell month-on-month to 16.4%, down from highs of over 20% last year. This decline follows RBI’s warnings to banks about unchecked personal loans. In November 2023, the RBI increased risk weights for unsecured loans: banks now face a 150% risk weight (up 25 points), and NBFCs 125% (also up 25 points). This policy change means banks must set aside more capital, resulting in higher interest rates for borrowers, effectively making unsecured loans less attractive and promoting cautious lending.
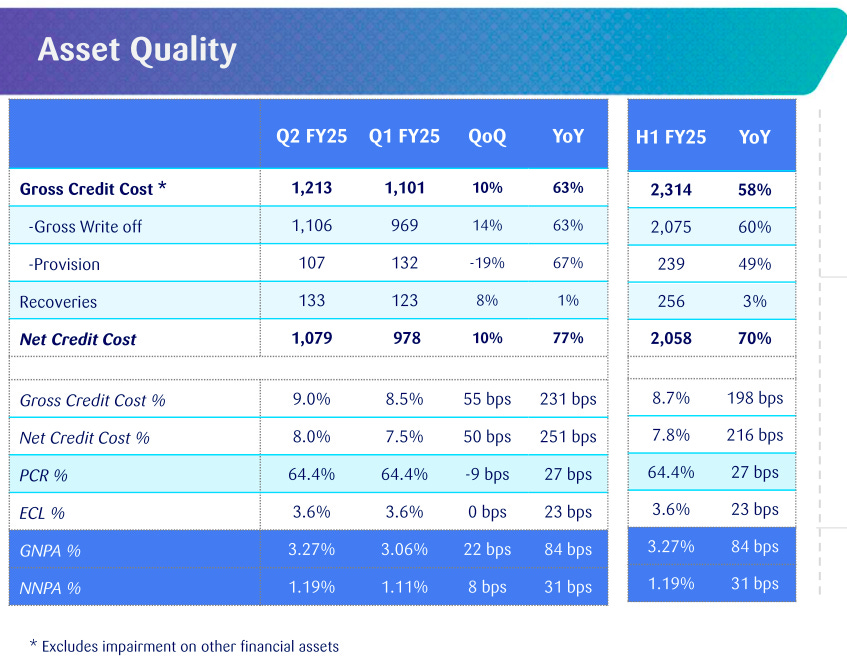
Additionally, non-performing assets (NPAs) have risen in certain retail segments, with banks and NBFCs reporting steady increases in retail loans and microfinance NPAs.
Housing loan growth remains strong, aligned with higher bank lending to real estate firms, especially in premium housing, which has thrived since COVID-19.
Credit card lending, once growing at 44% year-on-year in October 2023, has now dropped to 18%, influenced by RBI warnings and an increase in defaults. Many banks have reduced limits across some consumer segments. Rising funding costs have also impacted credit card issuers. For example, SBI Cards, India’s largest credit card issuer, has faced challenging quarters with rising NPAs, higher funding costs, and falling revenues and profits.

Gold loans have surged, showing 51% growth compared to just 14.6% last year. This increase aligns with rising gold prices, enabling borrowers to secure larger loans against their gold assets.
Shifting dynamics between public and private markets
Apollo Global Management’s recent report highlights an intriguing trend: a shift between public and private markets in the US and Europe.
More large companies are choosing to stay private instead of listing on public exchanges. This trend is especially noticeable in the US, where the number of publicly listed companies has dropped from around 8,000 in the mid-1990s to about 4,000 today.
This decline in public listings signals a fundamental change in how businesses access capital and organize their operations.
What’s fascinating is the scale of companies choosing to stay private. These aren’t just small businesses avoiding public markets.
In fact, 65% of private companies have revenues between $100 million and $500 million. Another 10% generate between $500 million and $1 billion, while 11% have revenues exceeding $1 billion.
The influence of private equity in the US market has surged. Their share of total US equity investments has grown from 3.8% in 2003 to over 10% in 2023.
For those new to private equity, these firms invest in mature companies that aren’t publicly listed. Instead of trading stocks, they either invest directly in private businesses or buy public companies to take them private. Their approach is simple: enhance the companies’ performance and eventually sell them for a profit.
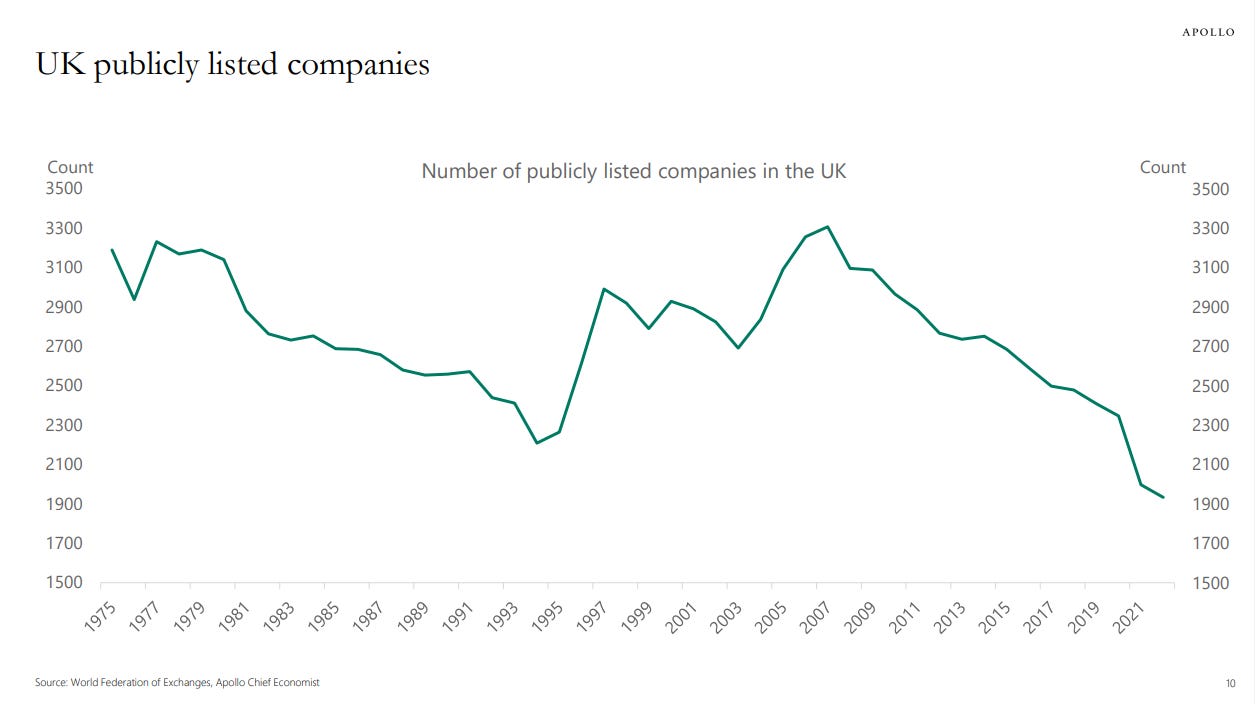
In European markets, especially the UK and Germany, there’s been a sharp decline in publicly listed companies. The numbers tell the story: listings have dropped from around 3,300 to just 1,900. This significant decrease highlights a shift away from traditional public listings in Europe.
While in Germany, the number has fallen from 800 to 400.
In Europe, 96% of companies with revenues over $100 million choose to stay private, reflecting a strong preference among European businesses to operate outside public markets.
So, why are more companies choosing to stay private?
There are several good reasons. First, with the rise of venture capital and private equity, companies can raise funds without going public—they no longer need a stock exchange listing to access capital.
Second, staying private gives companies the freedom to operate on their terms, avoiding the heavy regulations and detailed financial reporting required of public companies.
Finally, private companies aren’t under constant pressure from shareholders for quarterly profits. This freedom allows them to focus on sustainable, long-term growth instead of short-term gains to boost stock prices.
That’s all from us today. Let us know in the comments if you have any feedback, and do share it with your friends if you liked the post.


Insightful!!
Thank you for sharing these valuable info.