
The oil markets are in a weird place right now

Our goal with The Daily Brief is to simplify the biggest stories in the Indian markets and help you understand what they mean. We won’t just tell you what happened, but why and how, too. We do this show in both formats: video and audio. This piece curates the stories that we talk about.
You can listen to the podcast on Spotify, Apple Podcasts, or wherever you get your podcasts and watch the videos on YouTube. You can also watch The Daily Brief in Hindi.
In today’s edition of The Daily Brief:
Oil’s Strange Moment
The great currency division of the world
Oil’s Strange Moment
The oil market has been throwing up headline after headline. At first glance, it feels like noise. But the impact is already showing up in very real ways.
In the U.S., job cuts are piling up. Chevron is axing 8,000 roles, BP is letting go of 4,700, and ConocoPhillips says up to 3,250 staff could be gone by Christmas. Shale drillers are slowing too, with rigs and fracking crews at four-year lows. The world’s biggest oil and gas companies are slashing costs and scaling back investments at the fastest pace since the Covid crash, as they brace for a prolonged period of lower crude prices.
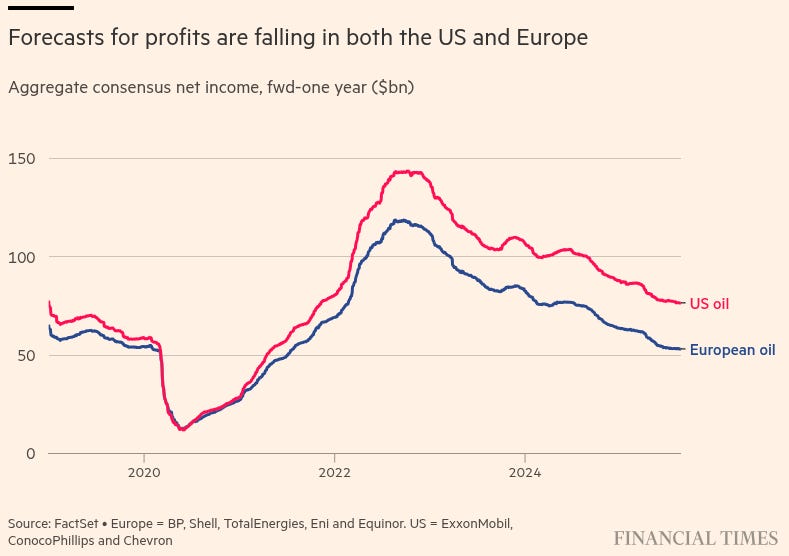
In the Gulf, two of the largest oil companies — Saudi Aramco and Adnoc — are scaling back their multibillion-dollar deal sprees as falling oil revenues bite. Their governments want dividends over splashy acquisitions — a clear sign that caution is back.
And in Russia, export revenues fell by $920m in August, one of the lowest levels since the Ukraine war. Discounts on Russia’s flagship Urals crude have widened to $3–$4 a barrel for Indian buyers, under U.S. pressure to cut purchases. India still buys, but at deeper discounts than just a few months ago.
So whether it’s layoffs, stalled deals, or steeper discounts — the fallout is real. And with so many moving parts, we dug deeper into what’s actually driving this moment in oil.
What’s Driving This
The short answer is that there’s a bit too much oil, not enough demand, and geopolitical developments that make the news without reducing the supply of barrels in the market.
Supply keeps climbing.
Back in 2023, prices were sliding down and the market looked over-supplied. OPEC+ stepped in with deep production cuts to “defend” prices — basically, trying to control supply (like a cartel) to keep oil above the benchmark of $80. For a while, this worked. But it also gave space for others — the U.S., Brazil, Canada, and Guyana — to pump more and take away market share from them. Naturally, because these new players pumped more, the prices came down from the artificial high set by OPEC, while also costing them to lose ground in its key markets.
So now, OPEC+ is bringing production back, to get back lost share. This time, however, they’re okay if it puts further pressure on prices — and hence the profits, too. But its competitors — the U.S., Brazil, Canada, and Guyana — have very little intention of stopping anyway. Global output was pushed to a record high of 106.9 million barrels-a-day (b/d) in August.
Demand isn’t keeping up.
The avenues that could absorb all this extra supply are drying up. Instead of a sharp rebound, demand looks stuck in low gear.
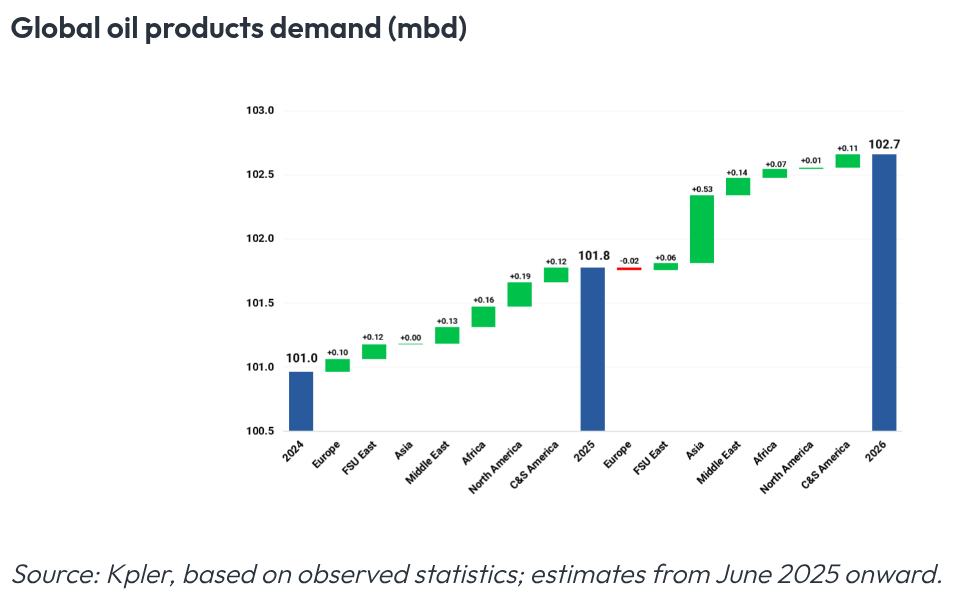
In Europe, refiners have been fairly bearish in their demand. Buying energy (their raw material) has become too expensive for them, weakening the profits in refining. The use of naphtha (an intermediate product of crude oil) is falling, while diesel is only getting a temporary lift from being used as a substitute for fuel oil. By next year, demand in the region could potentially turn negative.
In Asia, things look even softer. China’s gasoline use is slipping fast as EVs take more market share, and diesel is under pressure from LNG and electric trucks. India is still buying, but its growth is far weaker than what China’s boom years enjoyed. Southeast Asia is slowing too, weighed down by weaker trade and softer diesel demand.
There are some bright spots, though. Africa is still buying oil to support their infrastructure growth, and North America is seeing some resilience in jet fuel and LPG. But none of these pockets are strong enough to change the global picture: oil demand growth in 2025 and 2026 is forecast at less than 1% per year.
Put simply: consumer confidence, while not collapsing, is weak. And oil is being replaced in certain sectors like automobiles, which make things work. The demand side is nowhere near strong enough to soak up the barrels that the whole world keeps adding.
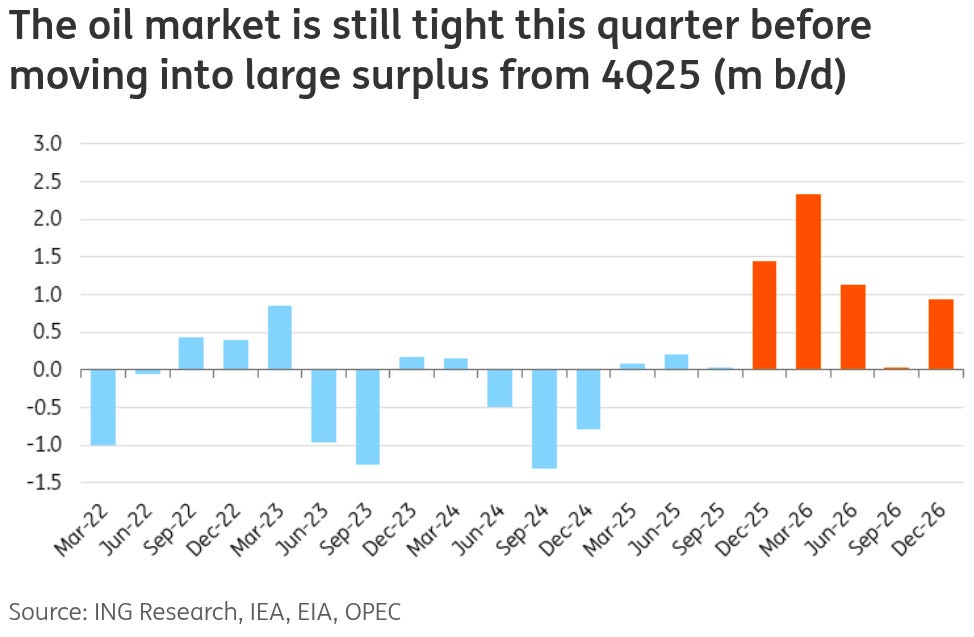
Inventories swell up
This has crowded the inventories of oil companies by a lot.
Month after month, storage tanks are filling up as supply quietly outpaces demand. Even though levels are still a bit below the five-year average, the steady builds show that the market has more oil than it can comfortably absorb. China has been a big buyer, adding millions of barrels to its reserves. That stockpiling has softened the blow, but it hasn’t reversed the trend. In fact, without China, the global surplus would look even worse.
This matters because inventories act like the market’s pressure gauge. When they rise, traders know there’s a cushion against supply shocks, which takes the heat out of prices. Unless something dramatic happens — like sanctions suddenly biting harder or a major disruption in the Middle East — these swollen stocks will keep a lid on any rally.
The bottom line on geopolitics
On the surface, the geopolitical backdrop looks explosive. Trump is threatening new sanctions on Russia’s buyers and even floating tariffs of up to 100% on China and India if they don’t cut imports. Ukraine keeps bombing Russian refineries and export terminals with drones. And in the Gulf, Israel’s strike in Qatar has raised fears of another flashpoint in the world’s most oil-sensitive region.
But peel back beyond the headlines a little, and you’ll see that the actual supply impact has been modest until now. Russia’s exports only slipped slightly in August, and most of its barrels are still flowing eastwards to China and India. However, India and China are driving harder bargains, so Russia has little choice but to sell at a discount.
The same goes for Middle East tensions. Usually, the markets account for the risks of escalating violence in the region by raising prices. But, unless something extremely devastating happens — like shipping lanes being blocked or production facilities being hit by missiles — the flows continue. For now, traders see the drama as more noise than shock. And that’s why prices stay capped: geopolitics makes the market nervous, but until it actually takes barrels off the table, the math of oversupply keeps winning.
The Bigger Picture
At the moment, the price of oil seems to be stably hovering just above the $65 / barrel mark. For consumers, it’s certainly a sweet spot — not high enough to pinch wallets, but not low enough to trigger panic about collapsing demand. There seems to be little volatility in oil prices.
But beneath the surface, this calm seems to be preceding a storm. Companies are cutting jobs, shelving projects, and freezing billion-dollar deals. Russia is selling crude at very steep discounts. Gulf producers are shifting from bold acquisitions to cautious dividend handouts. The pain is already real, even if the price graph doesn’t show it just yet.
And this is where the paradox lies. Every time the industry hits a downturn, it slams the brakes on investment. That’s rational in the short term, but history generally shows it sets the stage for the next crunch.
We’ve seen this movie before. In the late 1990s, for instance, oil collapsed below $10 due to the Asian Financial Crisis. Companies gutted spending, only for demand to roar back in the 2000s, sending prices over $100. Or take OPEC’s price war just after 2014, where the price crashed to $30, drying up investment, only to rally back later. In CoVID, oil briefly went below zero, which got companies to slash billions in projects — only for demand to outrun supply by 2022.
However, it does beg the question — is this time different? A useful question we like to ask ourselves in this regard is: is the structure of demand changing? Are we shifting more towards clean energy cars than internal combustion engines? Is solar energy filling our needs, or do we still need to burn more coal?
Right now, the answer seems to be in the middle. And, at least in the near-term future, if demand doesn’t collapse as fast as clean-energy forecasts suggest, the risk is that by 2027 the world will be scrambling for barrels again.
The great currency division of the world
Just yesterday, we covered how world trade is changing. Supply chains that once spanned continents seamlessly now navigate a maze of tariffs, sanctions, and "friend-shoring" policies. Countries are rethinking where they buy from and sell to, driven by political considerations as much as economic ones.
These shifts in global trade are being reflected in the currencies in which global trade is being conducted. And a comprehensive new study by the IMF offers a picture of how this reshuffling is playing out.
We’ll be diving into this report to look at what these trends are, and what they really mean for the medium of exchange we use in trading.
Let the dollar circulate
Imagine you lead an Indian company that makes protein bars, and one of your clients is a German retailer. When you sell to the retailer, most likely, you won’t really price it in your currency or Germany’s. Rather, you’ll invoice it in US dollars—even though neither country is the United States.
Now, why is that? People use the dollar because they consider it a “safe asset” — the country that issues this currency is (generally) politically stable, honors its debts on time, and therefore has a lot of trust among investors. And that creates network effects: the more everyone else uses it, the cheaper and easier it becomes for you to use them too. We covered this in an earlier piece.
In simpler terms, the dollar is the world’s dominant currency — much like how English is the common language of all business in the world.
Since the end of World War II, the US dollar has remained the dominant currency of the world. To this day, that status has remained stable. Nearly half of all global trade is invoiced in dollars — far exceeding America's share of world exports. Even if a trade doesn’t involve the US directly, it is very likely to be executed in the dollar.
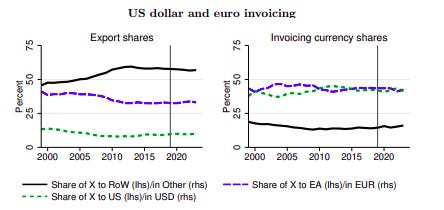
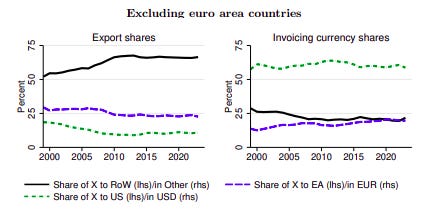
Second after the dollar, but still far behind, comes the euro — accounting for only 23% of global trade invoicing, and mostly used within European countries only. Which means that once you exclude the Eurozone from the analysis, the share of the dollar in global invoicing increases even more!
The shares of the dollar and the euro, the IMF finds, have been largely stable over time — despite a pandemic, geopolitics, supply chain disruptions, and a war in Ukraine.
However, there are nuances to this stability, and one of them lies in the rise of China.
The rise of the renminbi?
In sheer numbers, China is a juggernaut. It’s the world’s largest exporter by volume and also the second-largest country by economic output.
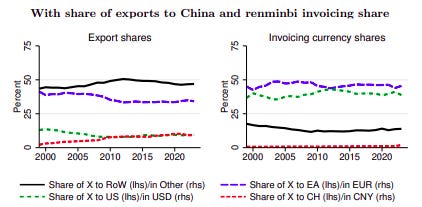
That economic strength, to some extent, is reflected in how popular its currency — the renminbi (RMB) has become lately. The IMF tracks the RMB’s growth over the last 3 decades, and finds that while initially concentrated in Asia, the RMB’s footprint in invoicing has gradually expanded, especially in the last decade.
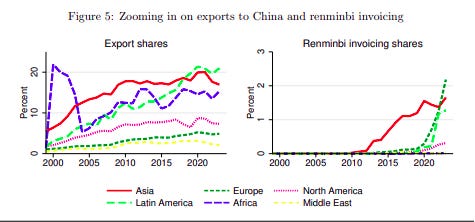
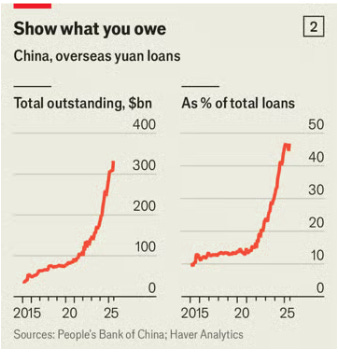
In fact, there’s some talk about how the RMB might someday replace the dollar as the dominant currency of the world. A strong indicator of that is how many loans China has given to other countries.
However, despite their economic might, the renminbi has a very modest, low single-digit share in invoicing. It’s nowhere close to attaining the status of a dominant currency right now.

This puzzle is explained by an interesting nuance: the difference between invoicing and settlement. Settlement is simply how you pay for something—like using a credit card versus cash at a store. Invoicing is what currency the price is actually set in—like whether a store posts prices in dollars or euros — which, in turn, influences exchange rates.
This distinction matters because it reveals something important. China has been effective at getting companies to use yuan as a payment method — which we know from the high settlement figures reported by their government. But it's been far less successful at getting the world to think in RMB (or yuan) terms when setting prices.
In other words, the RMB is valuable as a medium of exchange, but not necessarily as a measure of value of goods and services. And, as we know, for a type of money to be popular, it has to be both.
This shows up in the statistics, too. The IMF compares the total dollar value of global imports reported by China’s trading partners as being invoiced by RMB, against the value of China’s exports which are officially reported to be settled. The settlement figure is far higher than the invoice figure.
However, whether China really wants to be the dominant currency is also up for question — an argument raised by economist Michael Pettis. To make the RMB the dominant currency, China would need to abandon capital controls, allow unrestricted money flows, and become a net importer of goods rather than exporter — all things the US does. But China, where the state strongly controls the economy, may not be willing to give up that control.
Geopolitics — the elephant in the room
While the overall picture shows currency stability, a closer look reveals something more interesting. Geopolitics is increasingly influencing which currencies countries use, even if it’s less efficient from a cost-benefit perspective.
Countries least geopolitically aligned with the US tend to rely disproportionately on the dollar as a vehicle currency. In other words, countries that don't get along with America actually use the dollar more heavily than America's friends do. However, these countries account for a small share of global trade — hence, their share in global invoicing is also quite low.
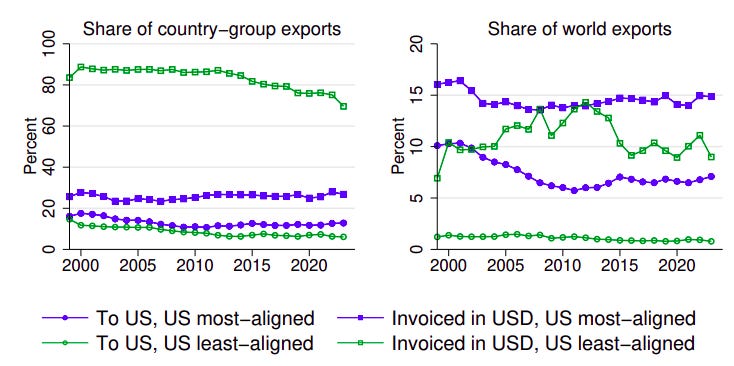
But this pattern is changing. The IMF finds that since 2021, the less a country is geopolitically aligned to the US, the more it’s likely to move away from using the dollar. In simple terms, countries that don’t like the US are reducing their dollar invoicing, while those distancing themselves from China have increased it.
This shift happens through several channels. The most obvious one is by changing your direct trade partner from the US to China, for instance. But another interesting channel involves not changing your direct trade partner at all with a system the IMF calls the “marginal cost channel”.
Here's how it works: imagine a factory in Vietnam that makes electronics for export. Traditionally, it might source computer chips from Taiwan (paid in $) and assemble them into products sold worldwide (also priced in $). This created a natural hedge—if the dollar strengthened, both the factory's costs and revenues would rise together. So far, so good.
But now, suppose geopolitical tensions make the Vietnamese company nervous about relying on Taiwanese suppliers. So, it switches to sourcing chips from the Netherlands instead, paying in euro. Suddenly, the company faces currency risk if it continues pricing its exports in dollars, since its costs are now in euros. So, to remove that marginal cost, the logical response should be to start pricing exports in euros.
This kind of supply chain reshuffling can change currency usage patterns, even when the final destination of exports (be it US or China) stays the same.
Nowhere is the impact of geopolitics on the currency shift more visible than in oil.
Now, when it comes to oil trade, the IMF finds no systematic, long-term evidence that the world is structurally moving away from the (petro)dollar. But this conclusion hides the pressures that already exist in the oil trade.
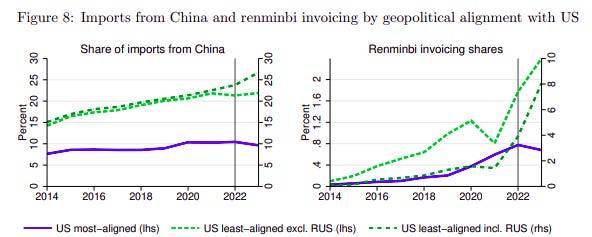
Russia, for instance, is increasingly shifting its energy exports to "friendly" countries away from the dollar and euro. Its massive oil flows to China and India are now largely settled in renminbi, rupees, and UAE dirhams. But this wasn't a market-driven decision—it was a response to being cut off from dollar-based financial systems after the invasion of Ukraine.
The shift has been dramatic. The IMF finds a very strong correlation between the rising share of Russia's imports sourced from China and the rising share of its imports invoiced in RMB. While Russia was always gradually moving away from the dollar and the euro, the Ukraine war accelerated the trend to a huge degree.
Russia isn't alone — China has also been actively building the infrastructure for a non-dollar energy market in Shanghai, which executes transactions with Gulf countries in yuan rather than dollars. Saudi Arabia — one of the world’s largest producers — is also in negotiations with Beijing to price some of its oil sales to China in renminbi. India, too, is considering using other currencies since we began importing a lot of oil from Russia — something we covered earlier.
The future of currencies
The emerging landscape is one of currency blocs, with a few currencies dominating certain regions in the world. This is a less integrated system where economic efficiency might even take a back-seat to political considerations. Countries may accept higher transaction costs in exchange for strategic autonomy.
The world still loves the dollar, and it will remain the world’s anchor for the foreseeable future. But the big question the IMF paper didn’t address was — will the US dollar continue to be a safe asset? Currently, it shows some signs of both political and economic instability — both requirements for a currency to be a safe asset. We covered this perspective in an earlier piece.
And what does this all add up to? Does it mean that we will move to a world where the dollar is no longer the dominant currency? Or are we moving towards a more fragmented system where no one currency can claim a monopoly? Moreover, is a fragmented system really that much better than a world where one currency dominates trade?
We have no sure answers to these questions. But what we do know for sure is that the world's money, like so much else, is now being divided along geopolitical lines.
Tidbits
India’s retail inflation inched up to 2.07% in August, still within RBI’s 2–6% band. Food prices rose slightly, though vegetables stayed cheaper year-on-year. With growth risks looming, tariffs biting, and Fed cuts likely, economists still expect RBI to ease rates later this year
Source: Reuters
RBI fined IPO-bound PhonePe ₹21 lakh for violating prepaid payment norms, after inspections flagged escrow shortfalls. The fintech company also surrendered its NBFC license in August. Despite regulatory heat, PhonePe readies a $1.2–1.5B IPO at a $7–8B valuation, launches a ₹700–800 Cr ESOP buyback, and retains 46.5% UPI share
Source: Inc42
BYD Co. has lost over $45 billion in market value after its Hong Kong-listed shares tumbled more than 30% from record highs, hit by concerns over its aggressive discounting strategy and intensifying competition from rivals like Geely and Leapmotor. Analysts say BYD’s price-led market share push is now backfiring, pressuring margins and earnings. Its June-quarter profit fell 30% — the first drop in over three years — and its annual delivery target was cut to 4.6 million units from 5.5 million.
Source: Business Standard
- This edition of the newsletter was written by Kashish and Manie
Have you checked out Points and Figures?
Points and Figures is our new way of cutting through the noise of corporate slideshows. Instead of drowning in 50-page investor decks, we pull out the charts and data points that actually matter—and explain what they really signal about a company’s growth, margins, risks, or future bets.
Think of it as a visual extension of The Chatter. While The Chatter tracks what management says on earnings calls, Points and Figures digs into what companies are showing investors—and soon, even what they quietly bury in annual reports.
We go through every major investor presentation so you don’t have to, surfacing the sharpest takeaways that reveal not just the story a company wants to tell, but the reality behind it.
You can check it out here.
Introducing In The Money by Zerodha
This newsletter and YouTube channel aren’t about hot tips or chasing the next big trade. It’s about understanding the markets, what’s happening, why it’s happening, and how to sidestep the mistakes that derail most traders. Clear explanations, practical insights, and a simple goal: to help you navigate the markets smarter.
Check out “Who Said What? “
Every Saturday, we pick the most interesting and juiciest comments from business leaders, fund managers, and the like, and contextualise things around them.
📚Join our book club
We've started a book club where we meet each week in JP Nagar, Bangalore to read and talk about books we find fascinating.
If you think you’d be serious about this and would like to join us, we'd love to have you along! Join in here.
Subscribe to Aftermarket Report, a newsletter where we do a quick daily wrap-up of what happened in the markets—both in India and globally.
Thank you for reading. Do share this with your friends and make them as smart as you are 😉
Put simply: consumer confidence, while not collapsing, is weak. And oil is being replaced in certain sectors like automobiles, which make things work. The demand side is nowhere near strong enough to soak up the barrels that the whole world keeps adding.
hey, was it supposed to be 'worse' instead of 'work'. amazing read as usual.
If one follows the logic of your oil piece, it would be evident that the classical supply demand model is being used for commodity pricing. Here are some additional facts that tell us that it is not the whole picture:
1. The forward curve has been in backwardation for 6-months although the spread has now tightened. This shows demand(prompt demand) is not low enough for the supply side to crash.
2. Except for Chinese inventories, which have swelled up on cheaper Russian crude in the last two months, other notable inventories are actually down 5 odd percent from LTA, particularly in the US. This is an indication that at these prices, the US is still the marginal supplier and while their cost of production is now bordering at break even, driving season just finished and it remains to be seen whether they will cut back a bit.
3. OPEC bringing back production was absorbed during the summer due to a hotter than usual season. They barely increased any exports above last year's average till about last month. Investment decisions now align with value KPIs and less and less with ESG. Thus, the cut back in investment.
When you add some nuances to the story, the 'bleak' demand argument doesn't seem that relatively stronger.
From a hedger's perspective backwardation in these prices, which is now at the average range of the last 20 years, means you're getting paid about a $1 odd to buy the back end of the curve going into 2026. It's almost a textbook bullish signal.