Hello and welcome to Beyond the Charts! A newsletter where we dive into fascinating charts from the world of finance and the economy, breaking down what’s happening in a way that’s easy to understand.
If you prefer watching video over reading, you can watch the episode here:
Over the past month, several major Indian companies have shared their quarterly results, and there’s a clear trend—many are falling short of their earnings expectations. When this happens across the board, it’s often a sign of larger economic challenges. So, in this week’s episode, we’re diving into what key high-frequency economic indicators are revealing about India’s current economy.
Think of these indicators as routine health check-ups for the economy—they give us a quick snapshot of how things are doing.
Auto sales
Let’s start with auto sales, which have been quite revealing. The Indian auto industry has been grappling with weak consumer demand over the past few months. Between May and September, sales took a noticeable hit, dipping consistently during this period.
October, however, brought a much-needed breather, thanks to the festive cheer of Navratri, Dussehra, and Diwali. Two-wheeler sales shot up by over 36% compared to last year, while cars and SUVs saw a solid 33% jump. Other segments, like three-wheelers and commercial vehicles—trucks, buses, and transport vehicles—also experienced strong demand. The only outlier was tractor sales, which continued to lag behind.
While this festive boost was a relief for automakers, it leaves us wondering: Can this positive momentum last, or will the industry slide back into a slowdown in the coming months?
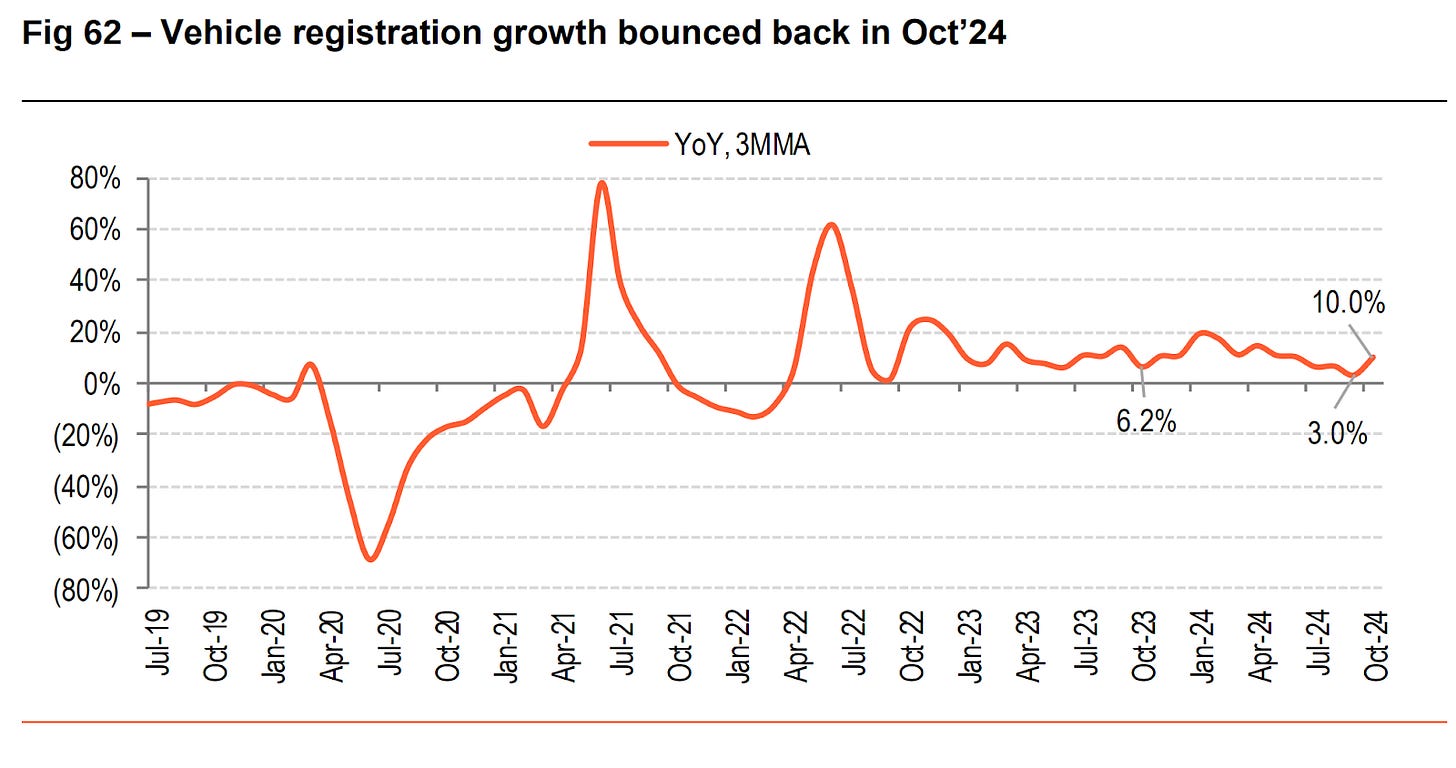
This festive bump is also reflected in the vehicle registration data, which saw a noticeable rise in October.
An interesting trend worth noting is the shift in consumer preferences when it comes to vehicle purchases. While electric vehicles are still in the early stages of adoption in India, electric two-wheelers have been gaining traction. Even though their sales are growing from a smaller base, they’ve managed to maintain steady growth and haven’t faced the same slowdown as traditional petrol-powered vehicles.
In the passenger vehicle market, the story is quite different. Electric cars and SUVs haven't gained the same traction as traditional petrol and diesel vehicles. However, CNG models have seen healthy growth in recent months.
Back to the topic of auto sales, let’s dive into what’s driving the slowdown.
First, weather disruptions have played a big role. Extreme summer heat followed by heavy monsoon rains and floods disrupted buying patterns during the first half of the year, leaving a noticeable impact on sales.
Second, dealer inventory management is adding to the problem. Many dealers, especially in the passenger vehicle segment, are grappling with high levels of unsold stock. This not only increases storage costs but also ties up their capital, creating a financial strain. To make matters worse, manufacturers continue pushing new stock onto dealers, forcing them to offer steep discounts just to move vehicles. While this may help clear inventory, it eats into dealer profits and creates cash flow challenges.
Third, economic factors are weighing down demand, particularly in the commercial vehicle segment. Reduced government spending has hit construction and infrastructure projects, which are major drivers for commercial vehicle sales. Take Tata Motors, for example—they recently reported a sharp 19.6% drop in domestic sales compared to last year, pointing to reduced activity in infrastructure projects and mining as key reasons.
This slowdown is also evident in wholesale volumes, which reflect purchases by dealers. Passenger vehicle wholesale volumes have taken a significant hit, while two-wheeler wholesale volumes appear healthier, according to ICICI Bank Research data. It’s a complex mix of factors, and it’s clear the industry is navigating through some tough terrain.

Signs of a broader slowdown
The slowdown isn’t limited to the automobile sector—it’s part of a broader dip in urban spending. Interestingly, rural demand seems to be picking up, likely helped by good monsoons. However, whether this rural rebound is a long-term trend or just a temporary blip remains to be seen.
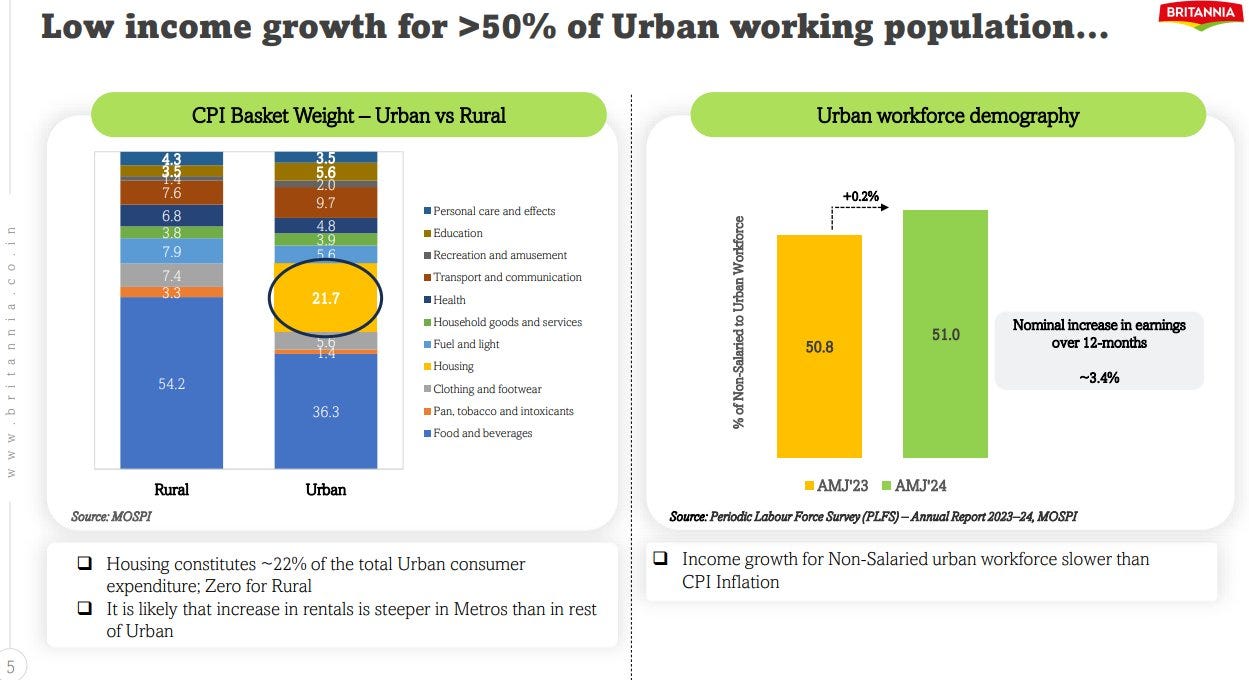
The slowdown in urban consumption is becoming evident in the results of FMCG companies. Britannia’s recent investor presentation highlighted that metropolitan areas, which contribute 30% of FMCG sales, are driving the decline—accounting for 2.4 times more of the sales drop than other regions.
This urban slowdown can be linked to two major factors. First, housing expenditure, which takes up around 22% of urban household budgets. Second, rising inflation—especially food inflation—has stretched household finances thin, leading to a cost-of-living squeeze. To make matters worse, most urban households haven’t seen any significant increase in their earnings, further straining their purchasing power. These combined pressures have left urban consumers with less to spend, impacting everything from essentials to discretionary purchases.

As mentioned earlier, inflation has been hitting households hard, and recent data shows some worrying trends.
CPI inflation climbed to 6.2% in October 2024, marking its highest level in 14 months and a sharp rise from September's 5.5%. What’s even more concerning is core inflation—which strips out volatile items like food and fuel—reaching a 10-month high.
This spike in inflation adds to the challenges already weighing on consumer spending. It further squeezes household budgets, which are already stretched thin due to stagnant incomes and rising living costs. The result? A deeper slowdown in spending across sectors like automobiles and FMCG, as consumers continue to cut back to make ends meet.
The main driver behind the recent spike in inflation is food inflation, particularly in the prices of vegetables and fruits. Right now, all hopes are pinned on the impact of good monsoons, which could help stabilize or bring down food prices. However, the relief will depend on how effectively the monsoons translate into better crop yields and improved supply.
Speaking of monsoons, we’ve had a fairly good season this year. That said, there are a few minor concerns—rainfall dipped below the long-term average toward the end of September. Despite this, the total accumulated rainfall for the season is still above the long-term average, which is a positive sign for agriculture and overall rural demand.

Another concern is that key agricultural regions like Punjab and Haryana received less rainfall than usual. It’s still uncertain how this shortfall will impact crop yields and, in turn, food prices. This is something we’ll need to keep a close eye on in the coming months.

Personal loans and consumer sentiment
The pullback in consumer spending is also showing up in personal loan trends, where there’s a noticeable slowdown across all categories. The steepest decline is in consumer durables financing—loans taken for appliances, furniture, electronics, and other household items.
This slowdown is largely due to two factors. First, rising inflation has left households with less disposable income for non-essential purchases. Second, borrowing has become more expensive, thanks to the RBI’s rate hikes. Since April 2022, the RBI has raised interest rates from 4% to 6.5% to tackle inflation. While central banks in other emerging markets and even the Federal Reserve have started lowering rates, the RBI has kept rates high to stay on top of inflationary pressures.
Credit cards and other personal loans, often used for expenses like travel, medical needs, and education, have also seen their growth slow significantly. This drop is closely tied to the RBI’s tighter monetary policy, which has made borrowing costlier across the board.
As we discussed in the last episode:
Concerned about the rise in unsecured lending, the RBI took action in November 2023 by increasing risk weights for unsecured loans:
Banks now face a 150% risk weight (up 25 percentage points)
NBFCs must maintain a 125% risk weight (also up 25 points)
With banks having to set aside more capital for these loans, it leads to higher interest rates for borrowers.
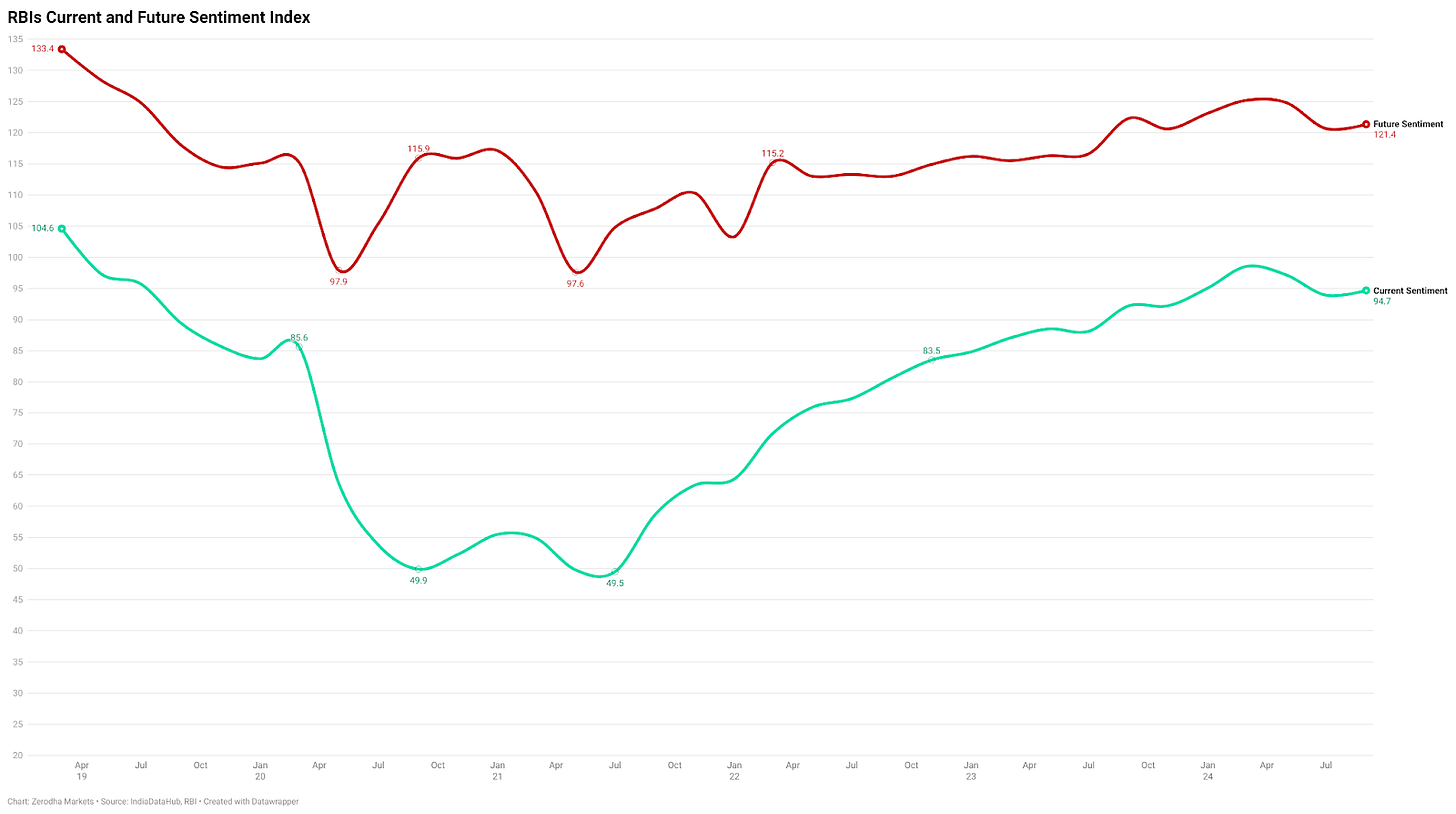
Despite the recent dip in consumer spending, Indians remain surprisingly optimistic about the economy, according to the RBI's consumer confidence survey. The Current Situation Index, which reflects how people feel about the economy right now, rose to 96.6 in September. Meanwhile, the Future Sentiment Index climbed to 121.4, showing that people are hopeful about where the economy will be next year.
This optimism suggests that while households are cautious with their spending due to high inflation and interest rates, they believe better times are ahead. It points to the possibility that the current spending slowdown might be a temporary adjustment rather than a sign of deeper economic trouble.
What are core industries saying about the economy?
Let’s talk about India’s core industries—the eight key sectors that form the backbone of our economy by providing essential raw materials and infrastructure support to other industries.
Unfortunately, their recent performance doesn’t paint a very encouraging picture. The core sector index, which tracks these industries, has been showing a troubling trend. After contracting in August, it managed only a modest growth of about 2% in September—the weakest growth since October 2022.
This sluggish performance in such foundational sectors raises concerns about the overall economic momentum and whether the slowdown is more widespread than initially thought.
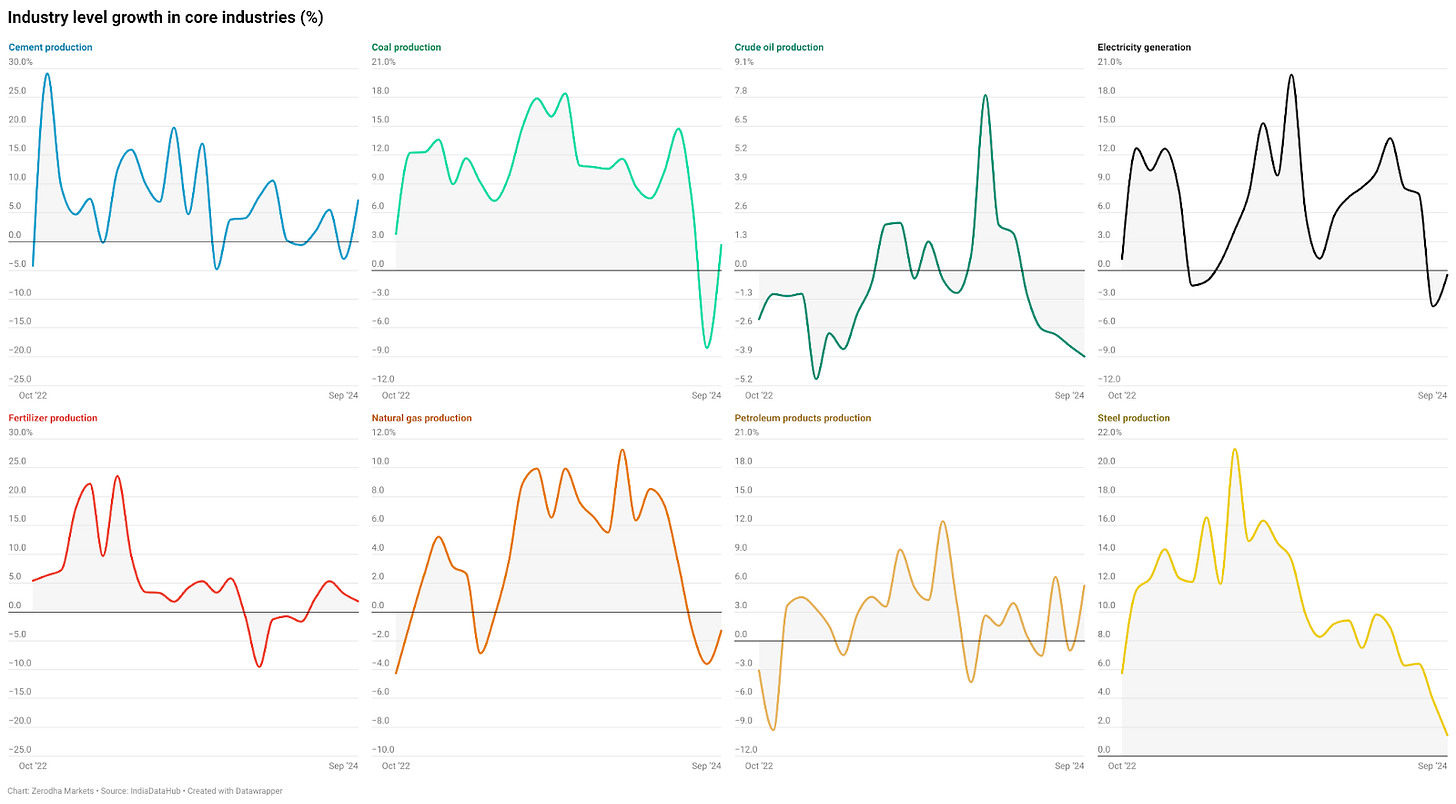
Breaking down the performance of individual core sectors reveals a widespread slowdown. Over the past few months, key sectors like cement, crude oil, fertilizers, petroleum products, and steel have been particularly weak.
While September showed a slight improvement, only three sectors—cement, crude oil, and petroleum products—managed to post any meaningful recovery. This limited rebound is concerning because these core sectors don’t operate in isolation; they’re tightly linked to the rest of the economy.
When such foundational industries remain sluggish, it raises the possibility of a broader economic slowdown. It’s like checking the economy’s vital signs—when these essential sectors are underperforming, it often points to reduced activity across other areas of the economy.
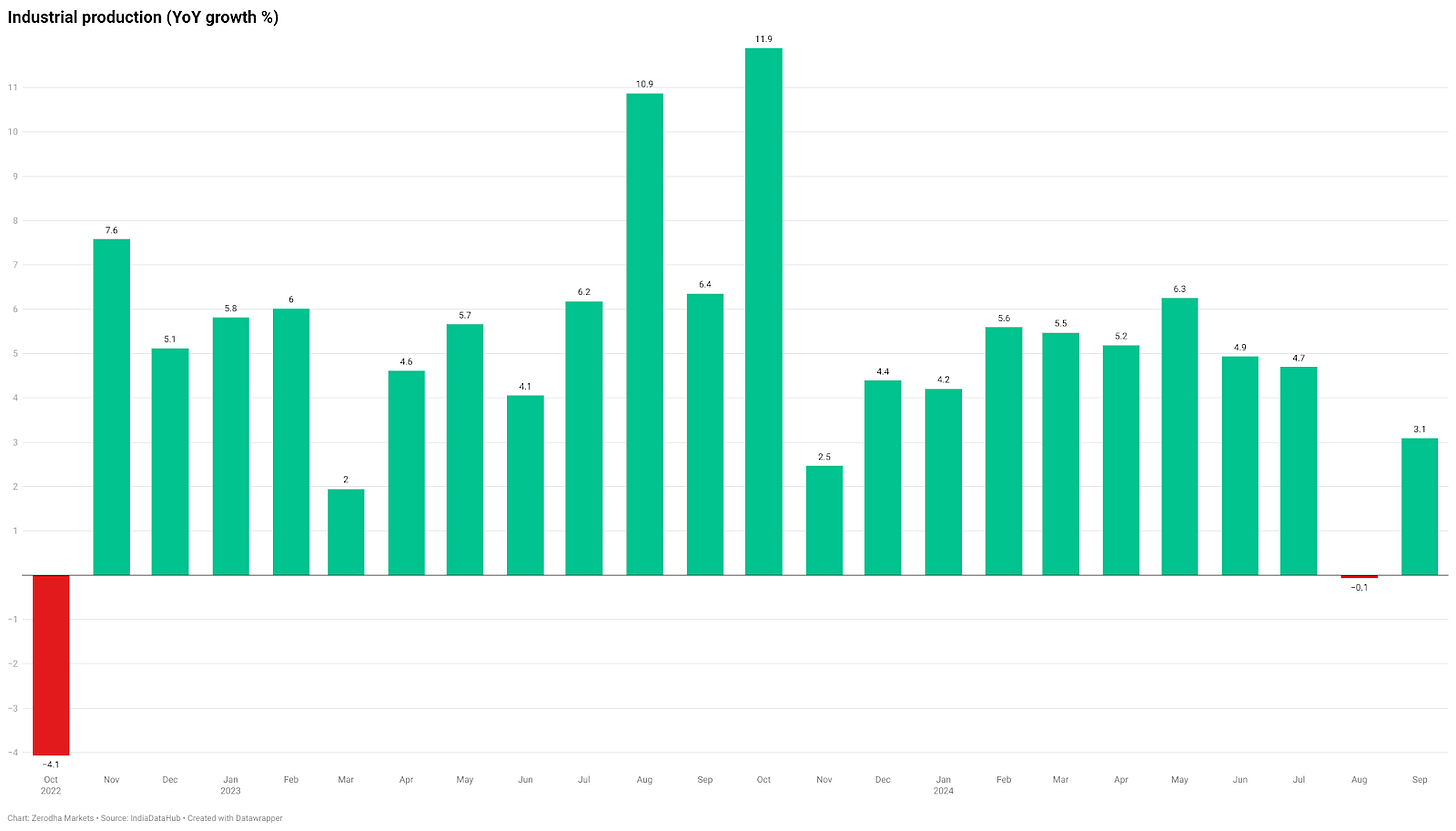
The sluggish performance of core sectors is also reflected in the broader industrial production numbers. Industrial production growth in September was just 3.1%. While this marks a slight improvement over August's figures, it’s still the slowest growth rate recorded since November 2023. This highlights the ongoing challenges in the industrial sector and raises questions about the pace of economic recovery.
According to the Motilal Oswal report, the slight improvement in industrial activity came primarily from two areas: mining and manufacturing.
Let’s start with manufacturing, which showed some promising signs. Output grew by 3.9% in September, a solid improvement compared to the modest 1.1% growth in August. However, the recovery is uneven—about half of all manufacturing items still grew more slowly than they did last year. While that might sound discouraging, it’s actually an improvement from August, when nearly 80% of items were lagging behind their previous year’s growth.
The mining sector also managed to claw its way back into positive territory with a 0.2% increase in September, recovering from a decline in August. However, this growth remains weaker than the levels seen last year, indicating that the sector is still facing challenges.
What stands out as particularly concerning is the electricity sector. Output grew by just 0.5% in September, marking its weakest growth in 17 months. Since power consumption often serves as a reliable indicator of overall economic activity, this sluggish growth could signal deeper underlying issues in the economy.

September 2024 brought some positive news for the consumer goods sector. Overall production reached its highest level in four months, showing a growth of 3.9%. This uptick offers a glimmer of hope amid the broader economic challenges, suggesting some recovery in consumer demand.

The strange part, though, is that despite the increase in production, sales of these consumer goods have been steadily declining.
When we look at energy consumption—a key indicator of economic activity—there are some concerning trends, particularly in the slowdown of diesel and electricity usage. These two energy forms are crucial because they power much of India’s economic engine.
Diesel consumption is a telling metric, as it fuels everything from trucks transporting goods to generators powering factories. Similarly, electricity usage underpins nearly every sector, making it a reliable gauge of overall activity.
Interestingly, the dip in diesel consumption might not be entirely negative. It could partly be attributed to the good monsoons this year. With ample rainfall, farmers rely less on diesel generators for irrigation, naturally reducing diesel demand. Seasonality might also be a factor—heavy rains during the monsoon can slow transportation and, in turn, impact fuel consumption.
While these explanations provide some context, the slowdown in both diesel and electricity usage raises broader questions about the state of economic momentum and whether it reflects deeper structural issues.
October brought some positive news for the manufacturing sector. After three months of slowing growth, India’s manufacturing PMI, as reported by HSBC, showed a rebound.
But before diving into the details, let’s quickly break down what PMI, or the Purchasing Managers’ Index, really means. It’s a key indicator of how well the manufacturing and services sectors are doing. Based on responses from senior purchasing managers at 400 manufacturing companies, it evaluates five critical areas: new orders, production, hiring, supplier delivery times, and inventory levels.
The index operates on a scale from 0 to 100. A reading above 50 indicates growth compared to the previous month, while anything below 50 signals contraction. It’s an insightful gauge of how top decision-makers view the economy’s direction.
Now, back to the latest PMI report—it outlines a few key drivers of this rebound:
Rising Orders: Domestic and international orders increased, leading to higher production volumes.
Employment Growth: Hiring picked up, reducing backlogs for the first time in over a year.
Improved Business Sentiment: Optimism grew, fueled by strong demand and new product launches.
That said, there are still some concerns:
Cost Pressures: Input and output prices rose due to ongoing inflation in materials, labor, and transportation costs.
Margin Squeeze: While demand is strong, these rising costs could eat into profit margins, posing a challenge for manufacturers moving forward.
Overall, while the rebound is encouraging, persistent cost pressures mean manufacturers still have to tread carefully.
GST and E-way bill collections
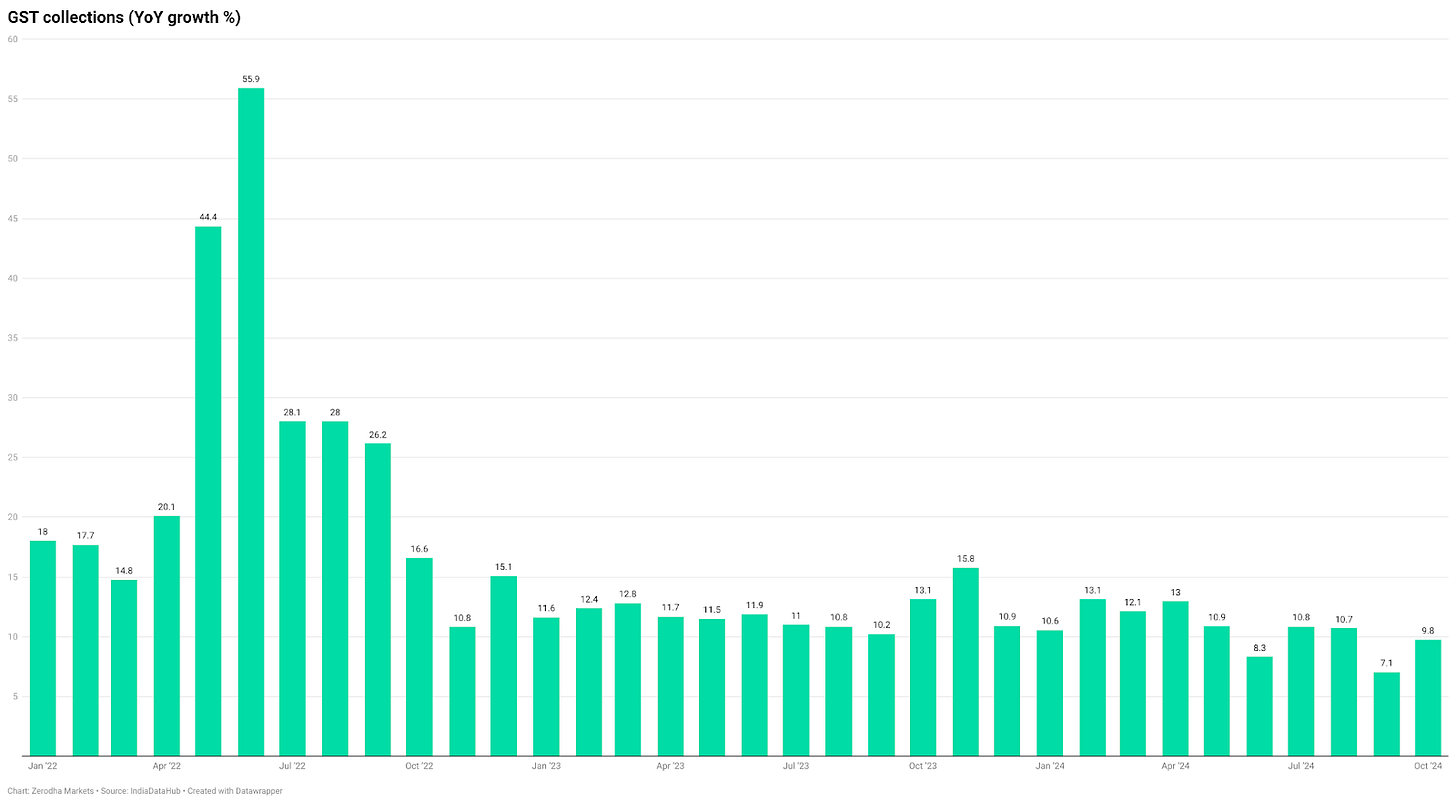
Let’s shift our focus to GST collections. Since GST applies to nearly everything we consume—goods and services alike—it serves as a reliable indicator of overall economic activity.
Strong collections usually point to healthy consumer spending, robust business sales, and an economy that’s performing well. On the other hand, a dip in collections could signal that people are cutting back on spending or that business activity is slowing down.
October’s GST numbers bring some good news, with collections hitting ₹1.87 lakh crore—a 9% jump compared to the same month last year. This growth indicates that, despite challenges in specific sectors like autos and core industries, there’s still substantial economic activity happening across the country. It’s a positive sign that shows parts of the economy are holding up well.
Another key economic indicator hit a high point in October 2024—e-way bill collections, which reached a record ₹11.7 crore, reflecting an impressive growth of nearly 19%.
But why do e-way bills matter? These electronic documents are mandatory whenever goods are transported within or between states in India. They track the movement of goods across the country, making them a strong indicator of transport and trade activity.
Both GST and e-way bill collections showed robust performance in October, boosted partly by the festive season. While GST collections have been growing steadily at 8-10%, e-way bill collections have outpaced them, consistently growing by over 14-15% in recent months.
This growth suggests that despite challenges in certain sectors, overall business activity remains resilient. High e-way bill numbers mean goods are moving actively across the country, signaling healthy trade and strong supply chain activity—an encouraging sign for the broader economy.
Cargo traffic and railway transportation
Let’s turn our attention to how ports and railway transportation are performing. These networks are key indicators of economic health because they handle a wide range of goods—from raw materials like coal and oil to finished products packed in shipping containers. When they’re busy, it’s a sign that businesses are producing, trade is active, and the economy is moving ahead.
But October’s numbers from major ports paint a less encouraging picture. Cargo volumes fell by 3.4% compared to the same period last year. This decline is particularly concerning as it breaks the momentum of the past four months, where growth was consistently in the range of 6%.
This dip could be a signal that trade and industrial activity are slowing down, raising questions about whether this is a temporary blip or the start of a broader trend. It’s something to keep an eye on, as these transportation metrics often give early clues about where the economy is headed.
The latest railway freight data isn’t very encouraging either. With just 0.2% growth in August—the most recent data available—rail freight movement has essentially flatlined.
This sluggish performance, coupled with the decline in port cargo volumes we just discussed, suggests a broader softening in demand across industries. Railways are often considered the backbone of the domestic goods movement, so weak growth here could indicate that industrial activity and internal trade are slowing down. It’s a signal that the economy might be losing some momentum, especially in sectors reliant on logistics and transportation networks.
MGNREGA demand and rural wages
Let’s take a closer look at what’s happening in rural India through the lens of MGNREGA—the government’s rural employment guarantee program. MGNREGA acts as a safety net for rural workers, providing guaranteed employment when regular work or farm income isn’t sufficient. Interestingly, lower demand for MGNREGA work often signals improved rural economic health.
The latest data offers some encouraging insights. In October, about 1.9 crore people sought work under MGNREGA, marking a 9.2% drop compared to last year. What’s even more promising is that this demand has been consistently declining for the past 12 months.
This reduction in MGNREGA applications suggests that rural India might be in better economic shape, likely thanks to favorable monsoons. It indicates that more people in rural areas are finding alternative employment opportunities or earning enough from their regular work, reducing the need to rely on the government’s employment program. It’s a positive sign that rural demand and activity could be on a more stable footing.
While the declining demand for MGNREGA jobs suggests that rural areas are seeing better job availability, there’s a concerning trend when it comes to rural wages. Although workers are earning more in absolute terms, high inflation—especially in essentials like food and fuel—is eroding their purchasing power. In real terms, many rural workers aren’t much better off, and some are even worse off than before.
There are a few reasons behind this trend, as Harsh Damodaran, National Editor on Rural Affairs and Agriculture at The Indian Express, explained in a recent article (link in the show notes):
Increased Labor Force Participation: More rural women are joining the workforce, increasing the labor supply, which in turn puts downward pressure on wages.
Agriculture Jobs Pay Less: Many new workers are finding employment in agriculture, a sector that typically offers lower wages compared to others.
Shift to Mechanization: Economic growth in areas relying on machinery over manual labor is reducing the demand for workers, limiting opportunities for wage growth.
So, while rural Indians might be finding jobs more easily, the quality of these jobs and their compensation aren’t necessarily improving their standard of living—especially with inflation making life more expensive.
India’s economic landscape is a bit of a mixed bag right now. On one side, there are clear challenges like slowdowns in core sectors and industrial production. On the other side, there are signs of resilience. Strong festive season spending and robust GST collections show that consumer confidence, while cautious, hasn’t completely disappeared.
That said, there are pressing concerns that need attention. The recent spike in inflation to a 14-month high is particularly worrying. It’s putting pressure on both consumers and businesses and is likely to keep the RBI from cutting rates anytime soon. The central bank will want inflation to settle well below 4% before considering any rate changes.
Looking ahead, a few key indicators will give us clues about the economy’s direction. Auto sales, for example, will be critical—can they maintain their festive season momentum, or will they slip back into a slowdown? The rural job market is another area to watch closely, as it often serves as a barometer for the broader economy. Inflation trends, too, will play a big role in determining what lies ahead.
Interestingly, consumer sentiment surveys suggest that people remain optimistic about the future, even though they’re holding back on spending for now. Whether this optimism translates into lasting growth depends on how the challenges and opportunities balance out in the coming months.
How overvalued are the Indian markets?
In the previous episode, we talked about the fall in Indian stock markets and explored some of the reasons behind it. Today, let’s shift our focus to the PE ratio, or price-to-earnings ratio, of Indian indices.
Think of it as the price tag for the stock market. Just like we compare prices while shopping, PE ratios tell us how much we’re paying for a company’s earnings. For indices like the Nifty 50 or Sensex, it’s calculated by dividing the total market value of all companies in the index by their combined earnings.
A high PE ratio means investors are paying more for every rupee of earnings, typically because they expect strong future growth.
A low PE ratio suggests stocks are cheaper, often due to pessimism about growth or overlooked value opportunities.
As markets have corrected significantly from their October peaks, the PE ratios for all major indices have also seen a meaningful decline.
The Nifty 50’s PE has dropped from over 24 to around 21.7, indicating reduced valuations.
This correction isn’t just limited to large-cap stocks. Indices tracking mid-caps, small-caps, and even micro-caps have also experienced smaller declines in their PE ratios from peak levels.
This trend suggests that valuations are cooling down across the board, likely due to weaker earnings expectations or reduced investor optimism. While these lower PE ratios might make the market more attractive for some investors, they also reflect the caution surrounding the near-term economic and corporate growth outlook.
Let’s turn our focus to another key market indicator—the Cyclically Adjusted Price-to-Earnings ratio (CAPE). Unlike regular PE ratios, which offer short-term insights, CAPE provides a longer-term perspective by adjusting for economic cycles. This makes it a valuable tool for understanding whether the market is overvalued or undervalued over time.
Currently, the CAPE ratios for both the Sensex and Nifty 500 have reached levels not seen since the 2008 global financial crisis. Like the PE ratios we discussed earlier, CAPE has also declined recently, reflecting market adjustments to widespread earnings misses across companies.
This data comes from a site maintained by IIM Professors Joshy Jacob and Rajan Raju. It’s an excellent resource for anyone looking to explore the CAPE ratio in detail.
We also touched on this topic in last week’s episode of Beyond the Charts and on The Daily Brief. If you want to dig deeper, check out the links provided in the description.
One important thing to remember about valuation ratios like PE and CAPE is that markets don’t always behave logically. They can stay overpriced or underpriced far longer than anyone might expect. As economist John Maynard Keynes famously said, "Markets can remain irrational longer than you can remain solvent."
While PE and CAPE ratios are useful indicators, they shouldn’t be the sole basis for deciding when to buy or sell. Think of them as one tool in your investment toolbox. In fact, valuation metrics are among the worst tools for market timing because markets can remain overvalued or undervalued for extended periods.
What these metrics can do is give you a sense of whether stocks are generally expensive or cheap. That’s it. When valuations are low, future returns tend to be higher, and when valuations are high, future returns tend to be lower. But they don’t tell you when things will turn.
Markets below 200 DMA, what next?
Now, on the topic of market corrections, the Nifty 50 index recently closed below its 200-Day Moving Average (DMA) for the first time since April 2023, which technically places it in bearish territory.
Why does this matter? When the market trades above its 200-DMA, it’s generally seen as a healthy, upward trend. But when it dips below, like it just has, it’s often viewed as a cautionary signal that the trend may be turning downward.
The silver lining? The last time the Nifty fell below its 200-DMA, the market bounced back within two months. But remember, past performance is no guarantee of future results.
We decided to dig a little deeper to see what typically happens when the Nifty drops below its 200-day moving average (DMA). Looking at historical data, here’s what we found:
Since 1996, the Nifty has closed below its 200-DMA 2,144 times—or roughly 30% of the time. So, while it might feel significant when it happens, it’s actually not that uncommon.
Of these 2,144 instances where the Nifty closed below its 200-day moving average, history shows a pattern worth noting:
Over 1 month, the Nifty delivered positive returns 60% of the time, with an average gain of 1.5%. In the worst case, investors saw a 39% drop, while the best case delivered a 35% gain.
Looking at a 6-month horizon, the numbers improve. The Nifty posted positive returns 63% of the time, with an average return of 8.4%. The worst scenario was a 50% loss, but the best-case scenario saw a remarkable 87.7% gain.
Over 12 months, the market's recovery becomes even clearer. Positive returns occurred 70% of the time, with an impressive average return of 19.4%. The worst case saw a 43.7% loss, but the best case brought a staggering 104% gain.
These figures highlight a key takeaway: while short-term volatility is common after the Nifty dips below its 200-DMA, history suggests the market tends to recover strongly over longer periods.
That was a long one 😅 thank you for sticking throughout. Do share this with your friends to spread the word.
Also, if you have any feedback, do let us know in the comments.


