
How UPI is Changing Cash Use in India


Our goal with The Daily Brief is to simplify the biggest stories in the Indian markets and help you understand what they mean. We won’t just tell you what happened, but why and how, too. We do this show in both formats: video and audio. This piece curates the stories that we talk about.
You can listen to the podcast on Spotify, Apple Podcasts, or wherever you get your podcasts and watch the videos on YouTube. You can also watch The Daily Brief in Hindi.
Just a quick heads-up before we dive in. The Tata Capital IPO opened yesterday. We wrote about it then, and you can read the full story here.
In today’s edition of The Daily Brief:
How UPI is Changing Cash Use in India
The Changing Tides of Global Trade
How UPI is Changing Cash Use in India
India has seen a digital payments boom in recent years, driven largely by the Unified Payments Interface (UPI). UPI launched in 2016 and went from a niche platform to handling over 17 billion transactions a month by 2024–25, accounting for 84% of all digital payment volumes.
With such explosive growth, a natural question arises: has this UPI wave actually reduced people’s reliance on cash?
That question isn’t just academic curiosity. It cuts to the heart of how India’s financial system operates. The amount of cash people hold, withdraw, and use affects everything from the Reserve Bank of India’s (RBI) currency management to broader liquidity and monetary policy decisions.
Here’s why it matters (broadly).
When people demand more cash, the RBI must print, move, and replenish it across thousands of ATMs which is an expensive, logistical grind. But it’s not just about currency notes. High cash demand also drains liquidity from banks, making lending tougher and nudging up short-term interest rates.
Flip it around: if UPI really cuts cash use, that cash stays in bank deposits. Liquidity improves, policy rates pass through faster, and money circulates more efficiently. So, “cash versus digital” isn’t about convenience; it’s about how money moves, how policy impacts, and how smoothly the economy runs.
So when the RBI asks: “Is UPI actually lowering cash demand?” — it’s really asking whether India’s payment revolution is changing the very plumbing of its financial system. The September 2025 RBI Bulletin paper, “Impact of UPI on Cash Demand – Evidence from National and Subnational Levels,” tries to answer exactly that and that’s what we will talk about today.
The RBI Study and Its Key Questions
What exactly did the RBI researchers set out to find? In simple terms, the study was looking to understand the relationship between UPI adoption and the demand for cash, both across India as a whole and – more importantly – in different states. Specifically, the paper set out to answer four key questions:
National Impact: Does the rise of UPI reduce the demand for cash at the all-India level?
Regional Patterns: How do different regions and states compare in terms of UPI adoption and cash preference?
State-Level Effects: Does increased UPI usage within a state lead to lower cash demand in that state?
Role of Income Levels: Does UPI’s impact on cash vary by a state’s economic profile or income level?
By investigating these questions, the RBI researchers hoped to shed light on whether UPI is merely an additional way to pay or a true substitute for cash, and how this dynamic might differ across India.
UPI’s nationwide impact with evidence
At the national level, the findings point to a clear trend: UPI is indeed eating into cash’s territory, though the story has some nuances. The study finds that higher UPI volumes are associated with lower cash demand overall. This suggests UPI is acting as a substitute for physical currency, not just a complementary payment method.
From a bird’s-eye view, India’s payment landscape appears to be undergoing a structural shift. Let’s talk a few big-picture data points and trends observed
First, cash growth is slowing
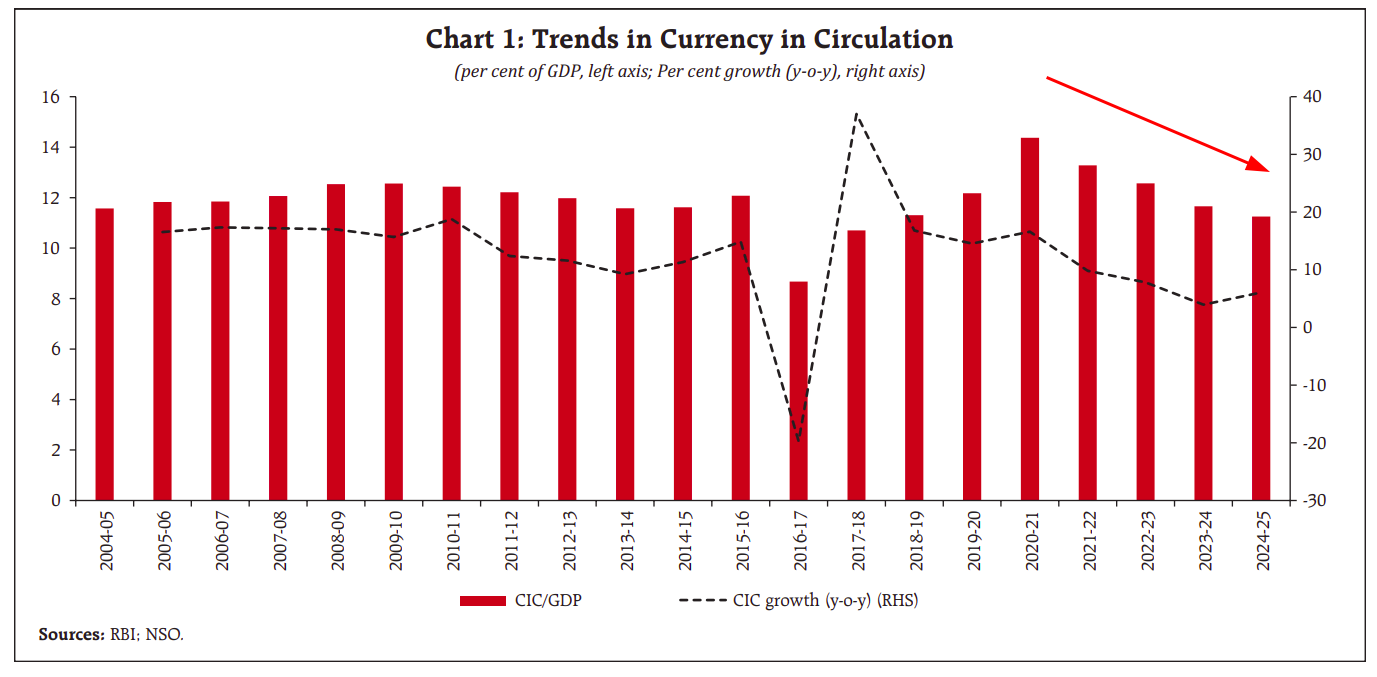
Currency in circulation (the cash out there with the public) is still growing in absolute terms, but much more slowly than before. In fact, cash growth has moderated significantly post-pandemic. Annual cash-in-circulation growth is down to about 4–6% in recent years, compared to much higher pre-UPI rates.
Importantly, when you adjust for inflation (looking at real cash demand), cash usage actually fell in 2023–24. That means the amount of cash people effectively use (in constant purchasing power terms) is declining, a strong sign that digital payments like UPI are replacing some cash transactions.
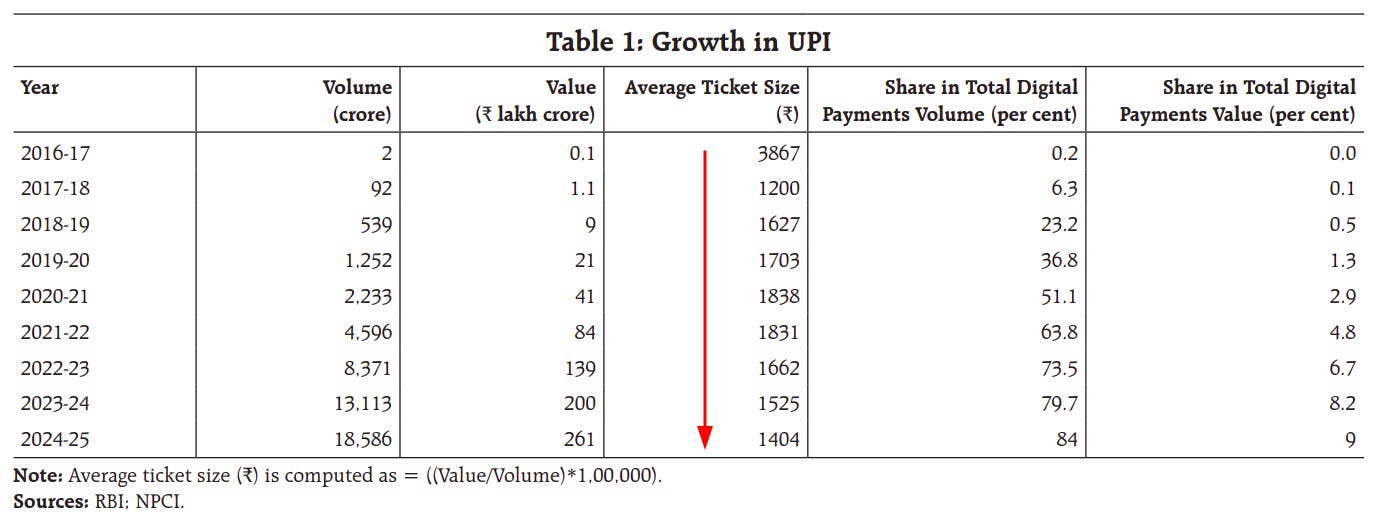
Second, shrinking average transaction size
Early on, people might have used UPI for larger, less frequent payments, but now even tiny payments are going digital. Average ticket size for UPI payment went from 3,867 in 2016-17 to 1,404 in 2024-25. The RBI paper notes “narrowing ticket sizes”, meaning the gap between big and small transactions is closing as more everyday micro-payments go through UPI. This hints at deeper penetration.
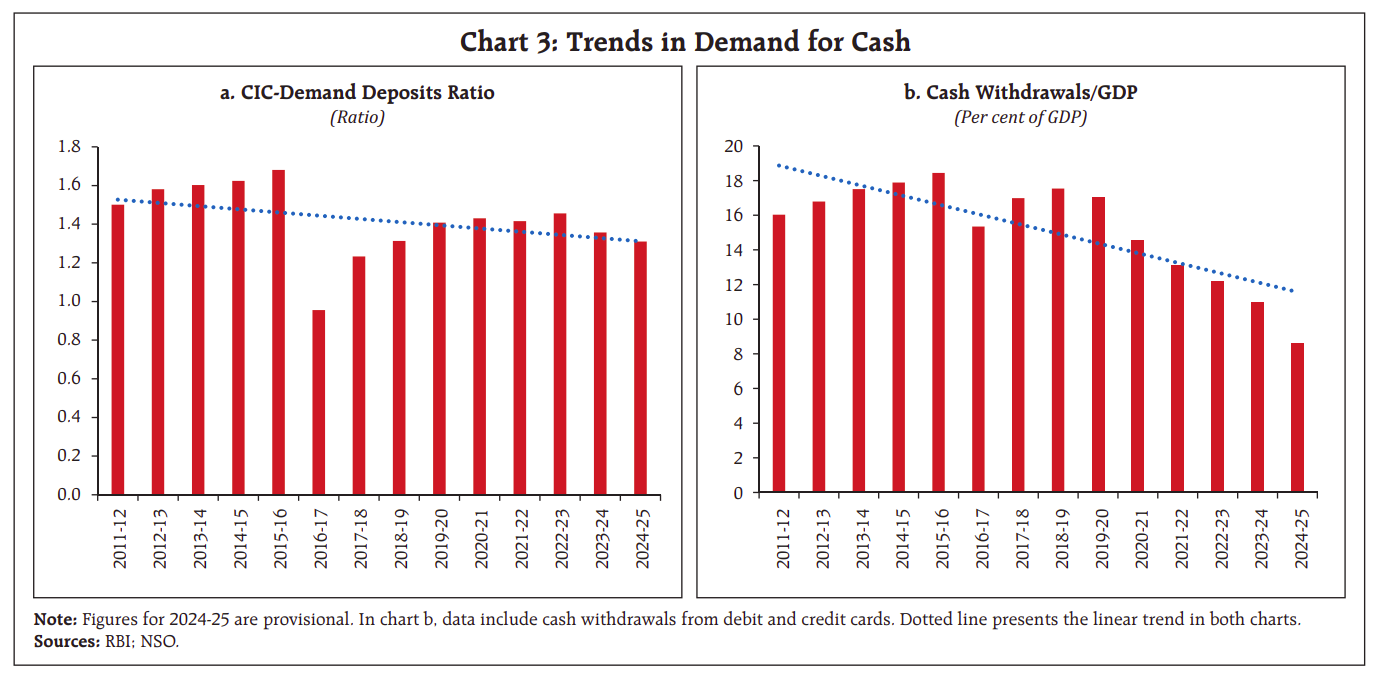
Third, decline of cash to bank deposits and its withdrawals
The currency-to-demand deposit ratio (cash in circulation versus money in checking accounts) has fallen from about 1.68 in 2015–16 to 1.31 in 2024–25. This is a key indicator: a lower ratio means that compared to deposits, cash forms a smaller chunk of money people hold. The drop signals that more money is staying in banks (and possibly being transacted digitally) rather than being taken out as cash.
Similarly, ATM withdrawals as a share of GDP have been steadily declining since around 2018–19. Fewer ATM withdrawals relative to the economy’s size suggest that people are not needing to pull out cash as often – likely because digital options like UPI are fulfilling many payment needs.
All these trends paint a picture of UPI making a serious dent in cash usage nationwide.
However, it’s not that cash has disappeared: currency in circulation is still increasing a bit each year and was even at an all-time high in absolute terms. The change is that cash isn’t keeping up with economic growth or inflation like it used to. India is moving toward digital payments, yet a “cash economy” undercurrent remains, growing at a subdued pace.
State-by-State Patterns
While the national story shows UPI substituting for cash overall, the state-by-state picture is more nuanced. India’s states differ widely in economic development, infrastructure, and culture – and these differences show up in how quickly people are embracing digital payments.
Let’s look at some data points.
The obvious one that stands out is that UPI adoption is concentrated but spreading. According to the study, 10 states account for about 80% of UPI transaction volumes. These are largely the early adopters and economically significant states. For instance, Telangana, Andhra Pradesh, Delhi, and Maharashtra are noted as having very high digital payment intensity. This makes sense as many of these states have large urban populations, strong tech ecosystems, or proactive digital initiatives. On the flip side, certain regions – especially in India’s north-east – are still heavily cash-reliant, with modest UPI uptake so far.
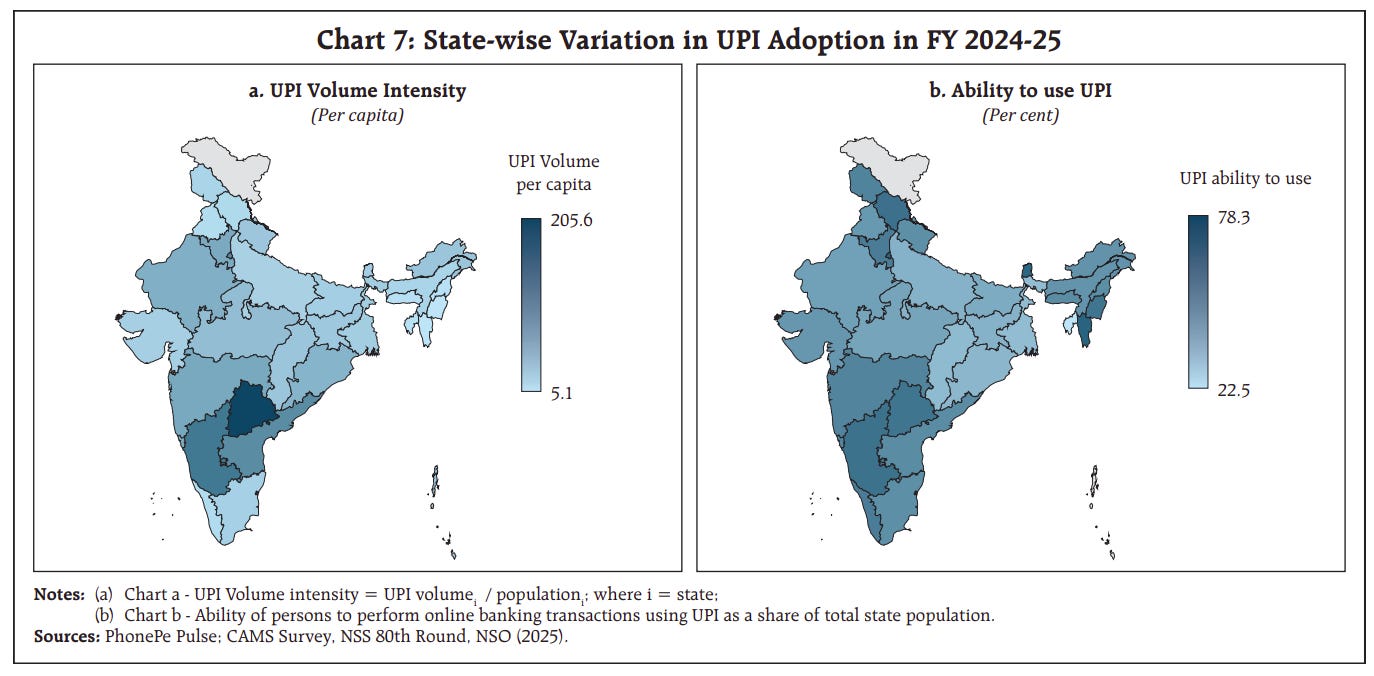
This reflects factors like lesser banking infrastructure, lower internet penetration, or simply habit and trust in cash in those areas. The gap between the leaders and laggards in digital payments is real, but there are signs that it is narrowing over time.
One encouraging finding from the report is that “most states saw a big surge in UPI adoption after the pandemic (around 2020–2022)”. COVID-19 pushed many people to go cashless for safety and convenience, accelerating digital payment growth even in states that were previously slow to adopt. Since then, the differences between states have been shrinking somewhat.
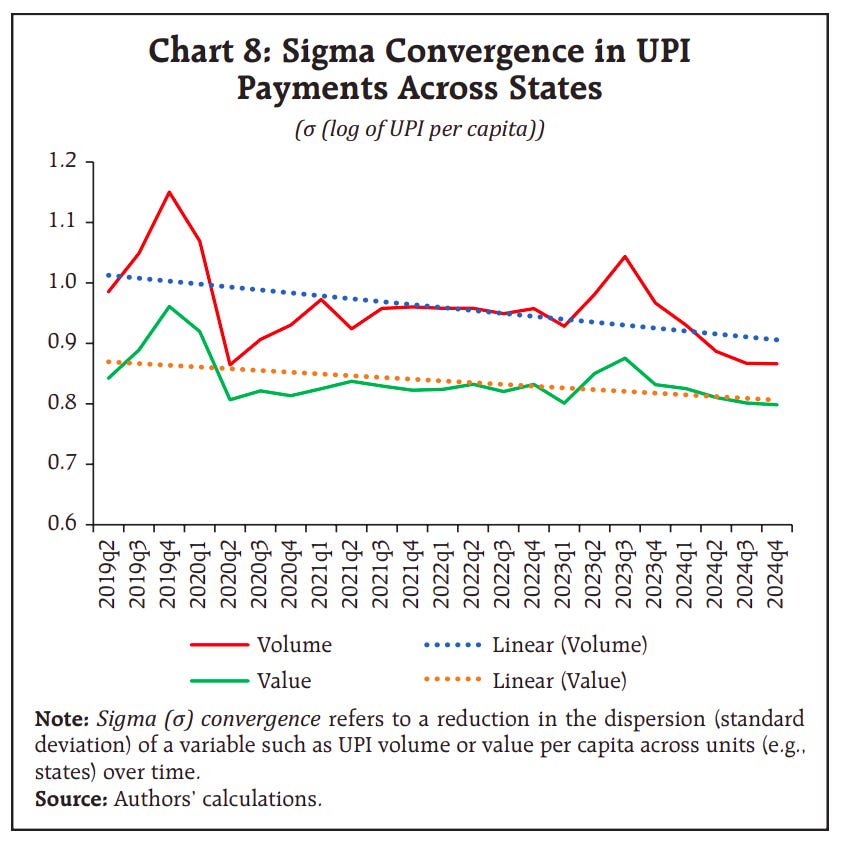
The RBI paper points to “early signs of convergence” – meaning the gap between high-UPI and low-UPI states is less stark than before. A chart on “sigma convergence” illustrates this: it tracks the dispersion of UPI usage across states over time. The dispersion (think of it as the digital divide) has been gradually decreasing, indicating that laggard states are catching up, albeit slowly.
In essence, UPI’s impact on cash is uneven across India – some states are nearly cash-light thanks to digital payments, while others are still cash-intensive. Yet, the trend almost everywhere is toward more UPI usage and relatively less cash.
This has important implications: if some regions remain cash-heavy, they could miss out on the benefits of digital finance, so identifying those lagging areas (as this study does) helps in targeting efforts to improve infrastructure and awareness. The convergence trend is a positive sign that the digital payment revolution is spreading beyond the big cities, bringing the whole country closer to a more uniform cash-vs-digital balance.
Insights and Nuances
Beyond the headline findings, the RBI paper offers some nuanced insights that are not immediately obvious. These insights help explain the why and how behind the numbers which we found really fascinating
First, Mid-income states are driving the change
Top-tier states (like those with very high incomes or GDP per capita) adopted UPI early but may now be nearing saturation in digital payments. Meanwhile, many mid-level states have room to grow and are now rapidly “catching up” as digital infrastructure improves.
The study’s findings by income level suggest that the impact of UPI was especially strong once states hit a certain development sweet spot, after which further gains taper off. In plain terms, a state doesn’t have to be the richest to go largely digital – once basic banking, smartphone access, and income levels cross a threshold, UPI adoption can really take off. This implies that states like those in India’s middle (not poorest, not richest) are pivoting faster from cash
Second, Education and formal jobs matter
The research underscores that human factors like education and formal employment play a big role in the cash-to-digital transition. States with higher education levels tend to use less cash and more digital modes – likely because educated individuals are more comfortable with technology and online banking. Likewise, a greater formal workforce means more people get salaries directly in bank accounts and have exposure to formal financial services, making them more inclined to use digital payments.
In contrast, in places with lower literacy or a predominantly informal economy (cash-paid daily wage jobs, etc.), people might stick to cash out of necessity or habit. This insight suggests that promoting financial literacy and bringing more workers into formal employment can indirectly boost digital payment adoption. UPI might be a tech innovation, but its spread is intertwined with broader socio-economic development.
Finally, behavioural inertia and saturation effects
One striking conclusion from the RBI study is that while UPI largely substitutes for cash, the effect is not linear – it diminishes at higher levels of digital adoption. In simple terms, the first wave of UPI adoption in a state can significantly cut down cash usage, but once digital payments become quite common, each additional increase in UPI usage yields a smaller reduction in cash.
This is attributed to factors like saturation (most people who are willing and able to switch have already done so) and behavioral inertia. The latter means some people or transactions are stubbornly sticking to cash even when digital options are available. For example, a small shopkeeper might continue to keep cash for convenience, or certain payments (like weddings, tips, or informal loans) might remain cash-based due to cultural habit. So, as UPI matures in a region, there’s a core cash usage that might not vanish easily.
The non-linear substitution effect basically says you get big gains early, then a plateau. Understanding this is important – it implies that even in a highly digital economy, a cash “floor” will likely persist.
The Changing Tides of Global Trade
Today, we’re diving into something that touches every single one of us, whether we realize it or not—maritime trade. The veins and arteries of the global economy.
Right now, as you’re listening to this, tens of thousands of ships are crossing the oceans, carrying everything from the phone in your pocket to the oil that powers your commute. From the grain in your morning toast to the minerals inside an electric vehicle battery.
The United Nations Conference on Trade and Development just released its Review of Maritime Transport 2025, and the subtitle says it all: “Staying the Course in Turbulent Waters.” Because that’s exactly what’s happening out there—turbulence. And what happens on the high seas doesn’t stay there. It shows up in your grocery bill, in fuel prices, and even in whether that package you ordered arrives on time.
First, the big picture.
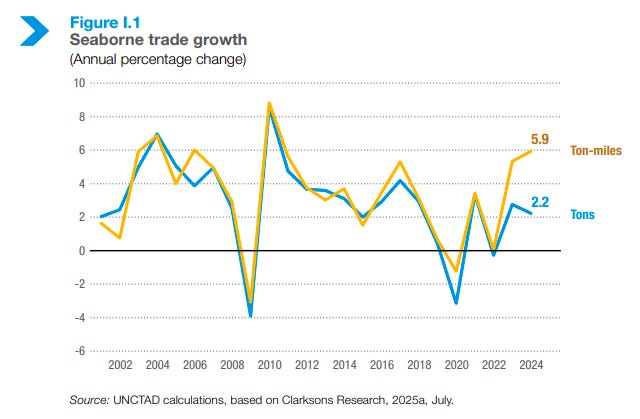
In 2024, global seaborne trade reached 12.7 billion tons—growing 2.2 percent, which sounds fine until you realize it’s below the long-term average.
But here’s the real story. It’s not about how much is being shipped, but how far it’s traveling. Ships are now taking longer routes. The average voyage length jumped from 4,831 nautical miles in 2018 to 5,245 in 2024 — roughly 400 miles more per trip.
Why does that matter? Longer routes mean higher fuel costs, more time at sea, more emissions, and less global ship capacity available at any given time.
While trade volumes rose just 2 percent, distance-adjusted demand—what’s called ton-miles, measuring both weight and distance—surged nearly 6 percent. In short, ships are carrying roughly the same cargo but sailing much farther to do it.
Why the detours? Because the world’s maritime chokepoints are under pressure.
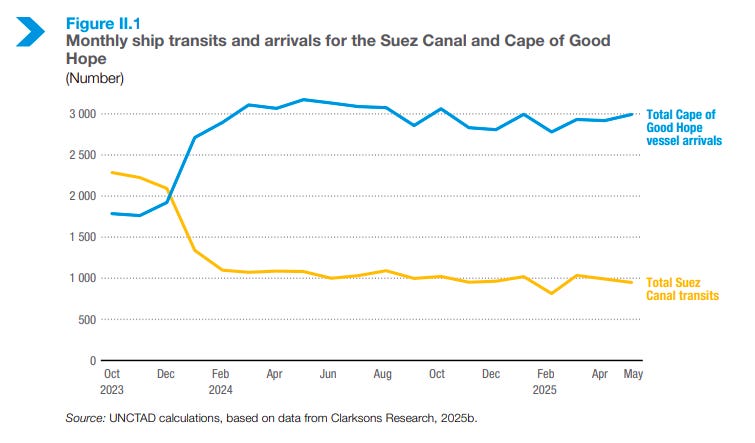
Ships that once sailed through the Red Sea and Suez Canal are now rerouting around Africa’s Cape of Good Hope—adding weeks to journeys. By May 2025, Suez Canal traffic was still down nearly 70 percent from 2023 levels.
The Panama Canal faced climate-driven water shortages through much of 2024, cutting its capacity. And in mid-2025, fresh tensions surfaced in the Strait of Hormuz — a passage that handles about a third of the world’s seaborne oil exports, with nearly 150 ships transiting daily. Any sustained disruption there would ripple through global energy markets.
For importing nations, these chokepoint risks translate directly into higher freight costs, delayed deliveries, and unstable supply chains. And this isn’t temporary. Red Sea disruptions have been ongoing since late 2023. Climate stress on canals is now a permanent factor. The world’s once-efficient shipping system is fragmenting.
Now let’s look at how the geography of trade itself is shifting.
For decades, it was simple—Asia made things, and the West consumed them. Goods flowed east to west.
That’s no longer the whole story.
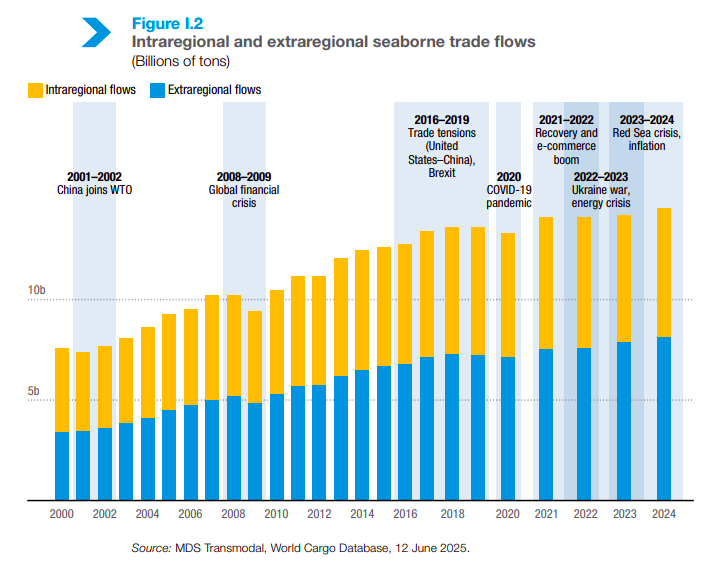
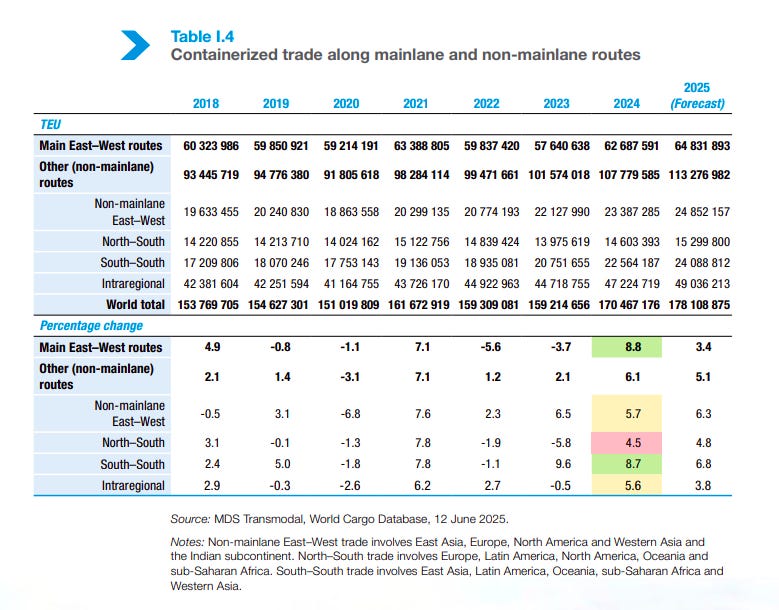
Container shipping—which moves finished goods like electronics, clothing, and furniture—is still dominated by three corridors: Asia–North America, Asia–Europe, and Europe–North America. But beneath that surface, something big is happening.
South–South trade is booming—between Asia and Latin America, Asia and Africa, and among developing economies themselves. In 2024, this segment grew 8.7 percent, faster than any other.
The reason? Diversification.
Companies are spreading their manufacturing bases. China remains the factory floor of the world, but Vietnam, Bangladesh, Thailand, Mexico, and India are gaining ground. The result is a more complex, regionalized web of trade. Instead of one hub, such as China, we now have several production centers serving multiple markets.
India sits right in the middle of this shift.
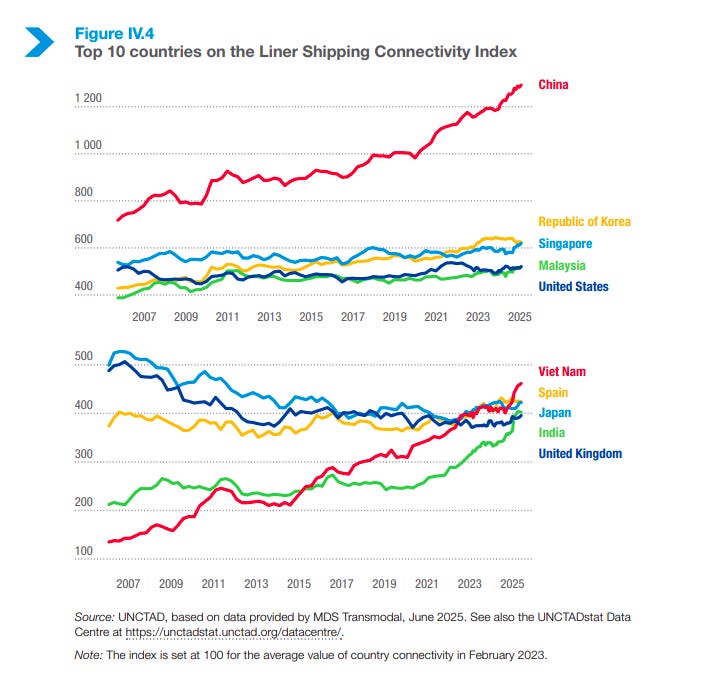
Ports like Mundra, Nhava Sheva, and the newly operational Vizhinjam are now hosting vessels over 24,000 TEUs—the largest container ships in the world. India’s global shipping connectivity jumped 18 percent between June 2024 and June 2025—the highest among major economies.
Connectivity drives competitiveness. More routes mean more options, lower costs, and faster delivery times—a major advantage for Indian exporters and importers alike.
But there’s a wildcard reshaping everything: tariffs.
In 2025, the US rolled out sweeping tariffs on Chinese goods, later expanding them to other partners—even proposing port fees on Chinese-built or operated vessels. Other countries responded in kind.
This isn’t just a policy fight on paper. It’s physically rerouting ships, redirecting cargo, and forcing companies to rethink where they source and ship from.
For India, that’s both a risk and an opportunity. Higher US tariffs on China could divert manufacturing toward India—the so-called China-plus-one strategy. But if global trade slows overall, everyone feels the hit. What we’re seeing is the unwinding of 30 years of hyper-globalized supply chains. Not a reversal, but a reconfiguration—more regional, more diversified, and increasingly shaped by politics, not just economics.
Now, let’s talk about something less visible but critical—minerals.
Copper. Cobalt. Lithium. Nickel. Graphite, etc., are the raw materials of the clean-energy transition—the stuff that powers electric cars, wind turbines, and batteries. And their trade is highly concentrated.
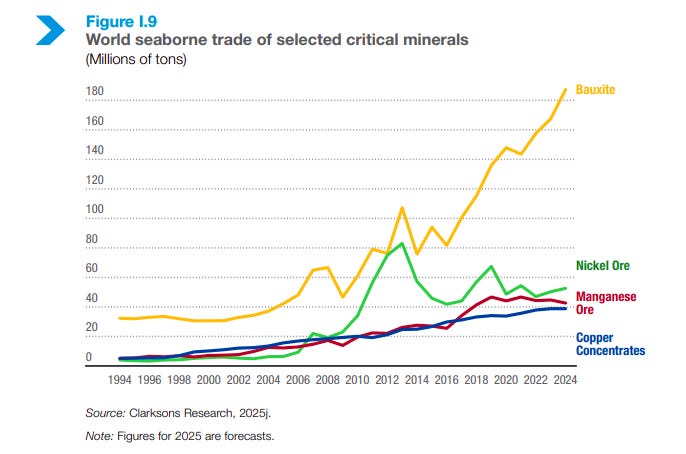
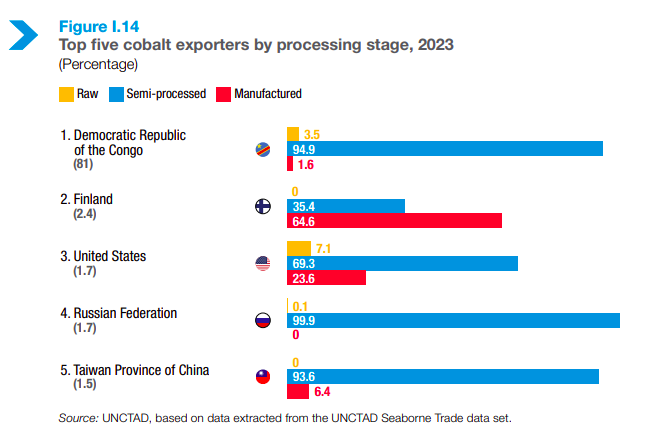
Over 80 percent of seaborne cobalt exports come from one country—the Democratic Republic of the Congo. While China handles most of the processing. Copper is dominated by Chile and Peru. Australia leads in lithium. And A handful of nations control both mining and refining.
To give you scale—since 1994, seaborne trade in nickel ore has grown more than twelvefold. Copper and manganese shipments have exploded too. This creates real strategic risk. If you’re building an EV or solar industry, your supply chain depends on a few countries—and it all moves by sea.
Most of these minerals are shipped as raw ore, processed abroad, and then turned into components. But that’s starting to change. Some exporters, like the DRC, are investing in local refining so they can ship partially processed materials and capture more value at home. For importers, the challenge is securing steady access at stable prices—ideally with more of the refining done locally.
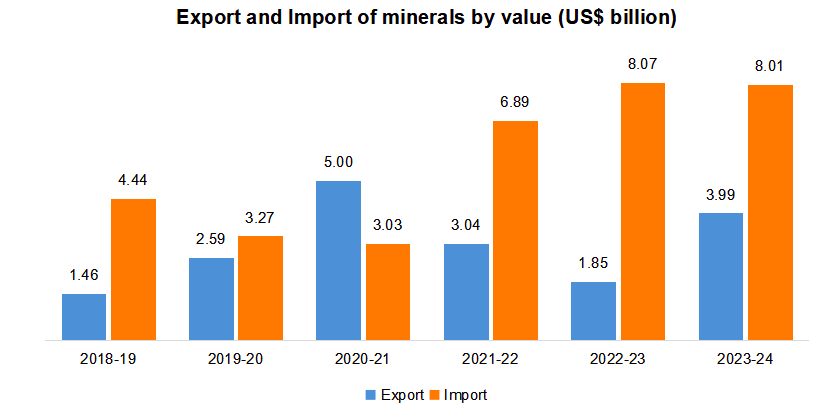
India is grappling with this right now. As it scales up EVs and renewables, it needs huge amounts of lithium, cobalt, and nickel—most of which are imported. Domestic exploration is underway, but it’ll take years. Ports also need specialized facilities for these materials—secure storage, safe handling, and proper regulation. If India develops those, it could become not just a destination but a processing or transshipment hub.
In short, critical minerals are quietly reshaping global shipping—creating new chokepoints, dependencies, and opportunities.
Let’s turn to the chaos of the past two years—because 2024 and early 2025 have been a mess for global shipping. The Red Sea crisis led carriers to reroute around Africa, cutting Suez Canal transits by nearly 70 percent year-on-year.
The Panama Canal struggled with drought-driven water limits. And in June 2025, tensions around the Strait of Hormuz sent tanker rates soaring—some doubled within a week due to war-risk premiums.
Add to that the tariff turbulence. In April 2025, the United States announced new port fees targeting Chinese-owned, Chinese-operated, and Chinese-built vessels—effectively taxing a huge slice of global shipping. Analysts estimated that if applied fully, these fees could total anywhere between $5 and $13 billion a year.
That announcement sent shockwaves through the industry. Shipping companies began scrambling—redeploying fleets, restructuring ownership patterns, and accelerating orders for non-Chinese-built ships. For global carriers, this wasn’t just a cost issue; it was a fundamental operational challenge.
For ports near major routes—like those in Mexico, Canada, or the Caribbean—there could be an upside as ships look for alternative transshipment hubs. But for the industry as a whole, this period has rewritten the map of global trade.
The old model of predictable, cost-efficient shipping has given way to something far more volatile—longer routes, higher costs, and an ocean trade system now deeply intertwined with geopolitics.
Now, let’s get to the part that hits all of us directly—freight costs.
Container shipping rates went wild in 2024. The Shanghai Containerized Freight Index—a benchmark for spot rates—averaged around 2,500 points for the year, up nearly 150 percent from 2023, and hit its highest level since the pandemic logistics crunch.
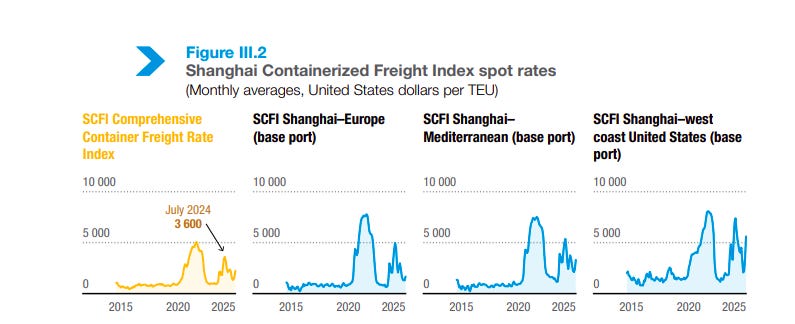
Why the spike? Longer routes around Africa. Higher fuel prices. Port congestion. And surprisingly strong trade volumes that kept demand for ships elevated. When the US briefly paused its new China tariffs in mid-2025, companies rushed to move goods before the window closed. In just one month, freight rates from Shanghai to the US West Coast jumped nearly 60 percent. To the East Coast, up more than 35 percent.
That kind of swing makes planning almost impossible for shippers and importers.If you’re running a business that depends on global supply chains, you’re essentially playing roulette with your logistics budget. A route that cost $5,000 a container one month could cost $8,000 the next—without warning.
And it wasn’t just containers. Bulk carriers and tankers—which move raw materials, coal, grain, and oil—also saw sharp swings.
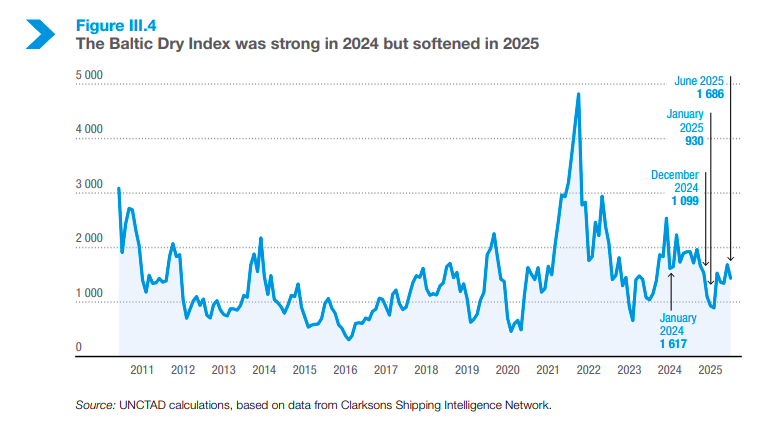
The Baltic Dry Index, which tracks bulk freight rates, averaged 1,755 points in 2024, up 27 percent from the year before. China and India’s appetite for commodities like iron ore, coal, and bauxite drove that strength. But as 2025 began, rates eased again as new ship deliveries added capacity.
Then came the oil shock. Tensions in the Strait of Hormuz in mid-2025 sent tanker rates soaring—some routes saw prices double in a week as war-risk insurance costs piled up. For major oil importers, that volatility directly hits energy costs—from refineries to retail fuel prices—and eventually, to what we all pay at the pump.
But freight isn’t just getting pricier because of geopolitics. It’s also being reshaped by climate policy.
The European Union’s new Emissions Trading System now includes shipping. Any vessel calling at an EU port must account for its carbon emissions and buy allowances—effectively paying for the pollution it causes.
And soon, the International Maritime Organization will apply similar carbon-intensity rules worldwide. In simple terms: ships that emit more will pay more. Depending on the route and vessel efficiency, that could add anywhere from a few dollars to over a hundred dollars per container.
It’s the right move for the planet—but yet another cost layer for a system already stretched by war, weather, and politics.
Now, let’s zoom out to the bigger trade picture. UNCTAD ran simulations to see what all these tariffs and disruptions could mean for global seaborne trade.
Under a moderate scenario, trade could shrink by 5 to 10 percent. Under a more severe one, closer to the higher end.
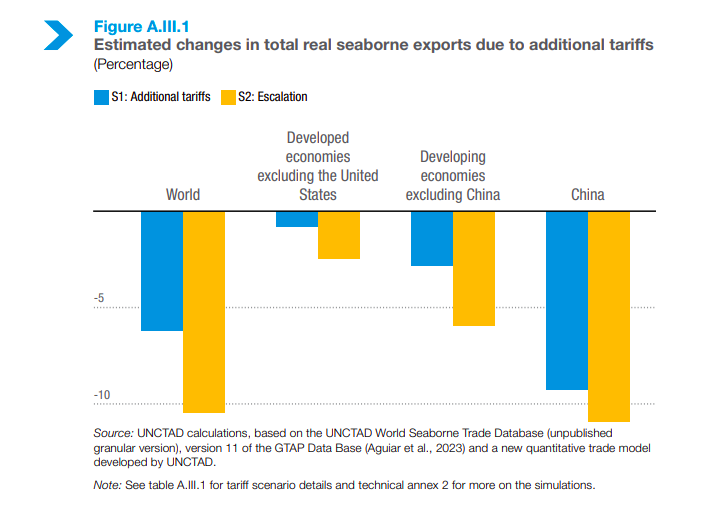
That may sound abstract, but a 10 percent drop means hundreds of millions of tons of goods not moving—fewer ships operating, slower growth, and higher costs that trickle through the entire global economy.
Developing countries would feel the squeeze first. Many rely on exports to advanced economies and don’t have the flexibility or infrastructure to quickly redirect trade elsewhere. In regions like Southeast Asia and Sub-Saharan Africa, countries such as Cambodia, Lesotho, and Madagascar could lose competitiveness in sectors like textiles and agriculture—industries that sustain millions of jobs.
But there’s a flip side. Not every developing economy loses out. If tariffs on China continue, some production will move elsewhere. Nations like India, Vietnam, Bangladesh, and Mexico are already positioning themselves to capture that diverted trade.
For India, the outlook is mixed. Higher tariffs could hurt exporters in steel, chemicals, and textiles, but they also open doors for manufacturing diversification. If global companies shift even a small share of production away from China, India stands to gain—provided it can deliver faster ports, smoother logistics, and reliable infrastructure.
This is where execution becomes everything. The next phase of global trade won’t just be about low costs. It’ll be about how fast countries can adapt to change—in manufacturing, in shipping, and in policy. Because tariffs don’t just shrink trade; they reshape it—altering routes, redrawing supply chains, and creating new winners and losers across the map.
Finally, let’s talk about the future, the rules that will define the next era of global shipping.
In April 2025, the International Maritime Organization agreed on a landmark Net-Zero Framework to cut emissions from ships. Expected to take effect in 2028, it sets binding carbon-intensity targets and introduces a global fund that rewards clean operators and penalizes polluters.
Here’s how it works: ships that emit more will have to buy remedial units from the IMO’s Net-Zero Fund—think of it as a carbon tax. Efficient or zero-emission vessels can sell their surplus credits or bank them for future use. The money raised will support developing countries—funding port infrastructure for alternative fuels, training seafarers, and helping shipowners modernize their fleets.
It’s one of the biggest changes in maritime regulation in decades—effectively putting a global price on carbon for the first time. But implementation won’t be easy. Shipowners will have to track fuel use, calculate emissions, and manage credit balances. Ports will need new bunkering infrastructure for fuels like LNG, ammonia, and hydrogen. And regulators will have to monitor compliance across thousands of vessels worldwide.
And then there’s the human side.
Nearly 2 million seafarers keep the global shipping machine running—many from India, the Philippines, Indonesia, and China. As the industry transitions to new fuels and technologies, these workers will need retraining and better protections.
In 2025, the International Labour Organization updated its Maritime Labour Convention to strengthen seafarers’ rights—on repatriation, shore leave, and working conditions. With crew shortages already rising, protecting their welfare isn’t just a moral responsibility; it’s critical to keeping trade moving.
Another major milestone came that June, when the Hong Kong Convention on safe and environmentally sound ship recycling finally came into force.
For years, shipbreaking—especially in India, Bangladesh, and Pakistan—has been plagued by dangerous conditions and pollution. The new convention mandates stricter safety and environmental standards, forcing yards to modernize and maintain certified facilities.
It’s a change that makes the process safer for workers and cleaner for the planet—though at higher costs for shipowners. Over time, that could speed up the renewal of the global fleet, replacing older, dirtier ships with newer, greener ones.
So where does that leave us?
Maritime trade is standing at a crossroads. The old model—cheap, predictable, and ruthlessly efficient—is giving way to one that’s more fragmented, expensive, and shaped by geopolitics and climate policy.
Chokepoints matter. Tariffs matter. Regulations matter.
For major trading nations like India, this is both a challenge and a moment of possibility—to build resilient infrastructure, capture new trade, and lead in cleaner, smarter logistics.
The countries and companies that will thrive are those that look beyond efficiency, who invest in reliability, sustainability, and adaptability. Because globalization isn’t dead. It’s evolving. Ships will keep crossing oceans. Trade will continue.
The question is: what will this next version of globalization look like? Who will it serve? And can we build a system that’s not just efficient — but also fair, sustainable, and resilient?
Tidbits
Indian IPOs set for record October
India’s IPO market is booming, with companies likely to raise a record $5 billion in October despite volatility in listed equities. Tata Capital and LG Electronics India are leading billion-dollar offerings. Analysts say this IPO surge may be drawing liquidity away from existing stocks.
Source: BloombergSmartphone loan defaults rise
Loan defaults on smartphone purchases have climbed to nearly 3%, above the usual 2%, as brands push premium upgrades through easy EMIs. Lenders are tightening credit in high-risk areas, while retailers face pressure to absorb losses. Slower loan growth and rising delinquencies are now weighing on consumer finance.
Source: Economic Times
- This edition of the newsletter was written by Kashish and Bhuvan
So, we’re now on Reddit!
We love engaging with the perspectives of readers like you. So we asked ourselves - why not make a proper free-for-all forum where people can engage with us and each other? And what’s a better, nerdier place to do that than Reddit?
So, do join us on the subreddit, chat all things markets and finance, tell us what you like about our content and where we can improve! Here’s the link — alternatively, you can search r/marketsbyzerodha on Reddit.
See you there!
Introducing In The Money by Zerodha
This newsletter and YouTube channel aren’t about hot tips or chasing the next big trade. It’s about understanding the markets, what’s happening, why it’s happening, and how to sidestep the mistakes that derail most traders. Clear explanations, practical insights, and a simple goal: to help you navigate the markets smarter.
Check out “Who Said What? “
Every Saturday, we pick the most interesting and juiciest comments from business leaders, fund managers, and the like, and contextualise things around them.
Subscribe to Aftermarket Report, a newsletter where we do a quick daily wrap-up of what happened in the markets—both in India and globally.
Thank you for reading. Do share this with your friends and make them as smart as you are 😉