
Between solar panels and refineries
The new energy trap

Our goal with The Daily Brief is to simplify the biggest stories in the Indian markets and help you understand what they mean. We won’t just tell you what happened, we’ll tell you why and how too. We do this show in both formats: video and audio. This piece curates the stories that we talk about.
You can listen to the podcast on Spotify, Apple Podcasts, or wherever you get your podcasts and watch the videos on YouTube. You can also watch The Daily Brief in Hindi.
In today’s edition of The Daily Brief:
Energy security is no longer a fuel problem
India's Missing Poor
Energy security is no longer a fuel problem
India is doing two seemingly contradictory things at once.
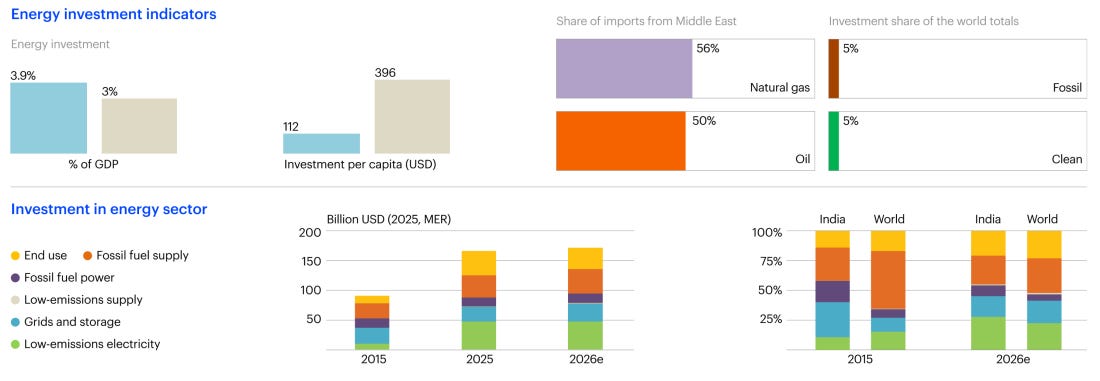
On one side, we’re shifting to clean power as fast as any large economy on earth. Five years ago, for every rupee we put into fossil-fuelled electricity, we spent roughly a rupee and a half on renewables and nuclear power. Today, that has climbed to thrice as much. Solar and wind now make up more than half of our installed power capacity, with solar investment alone climbing about 25% a year.
At the same time, however, we’re building oil refineries at the fastest pace in years. Our refining investments have grown at around 23% a year over the past five years, and we’re on track to add roughly 15% more by 2030. Almost all the crude we process is imported. And so, the more we expand our refining capacity, the deeper our reliance on imported oil grows.
Why are we simultaneously trying to insulate ourselves from fuel imports, while also placing a bigger bet on the most import-dependent part of its energy system? Well, the energy world is in a weird inflection point, at the moment, all we can do is hedge.
It isn’t just us, though. As a new report from the International Energy Agency (IEA) notes, what the world considers “energy security” is changing rapidly.
To fuel, or not to fuel
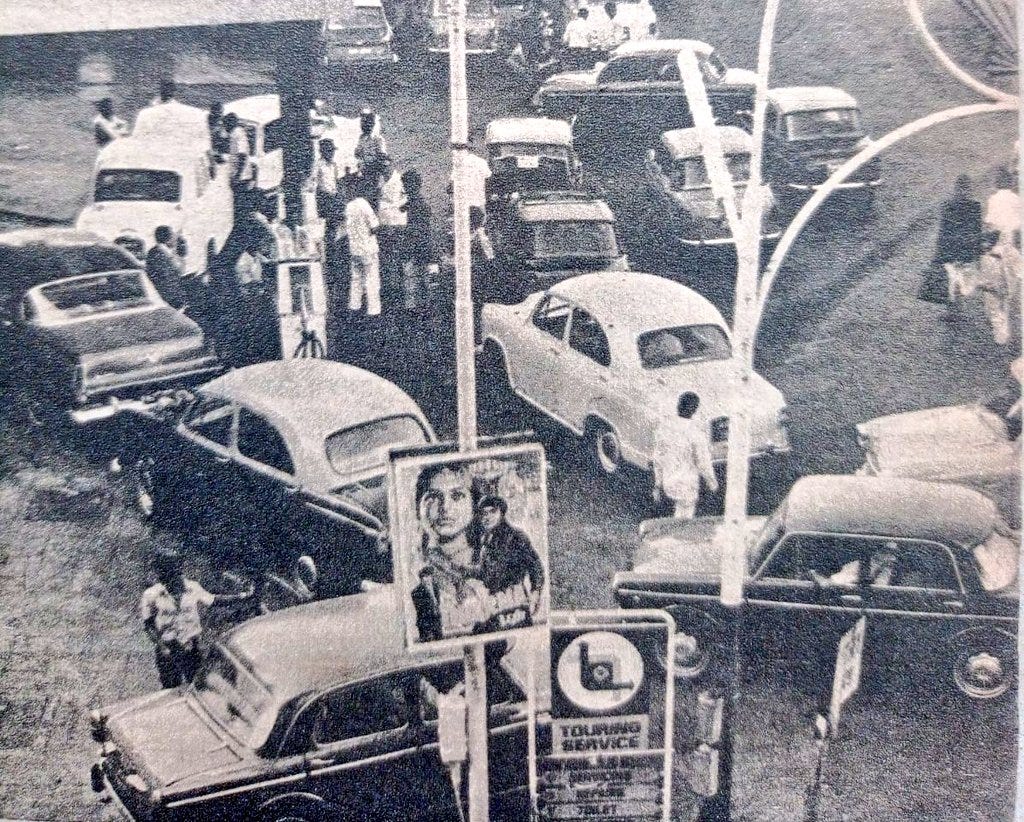
For most of the last half-century, “energy security” meant you needed to keep fuel flowing. Fifty years ago, when the world had been hit by the oil shock of 1973, it responded by finding more oil in safer places — like the North Sea. It also moved to use each drop of fuel it had more carefully, with fuel-economy rules and efficiency standards.
We now find ourselves in such a moment again, this year.
This time around, the IEA describes a very different instinct taking hold. The most reliable defence against being held hostage for oil, countries are quickly discovering, is to not need any. If you can get energy in a form that you don’t have to import or burn though, you are immune to being embargoed, blockaded or priced out from another corner of the world.
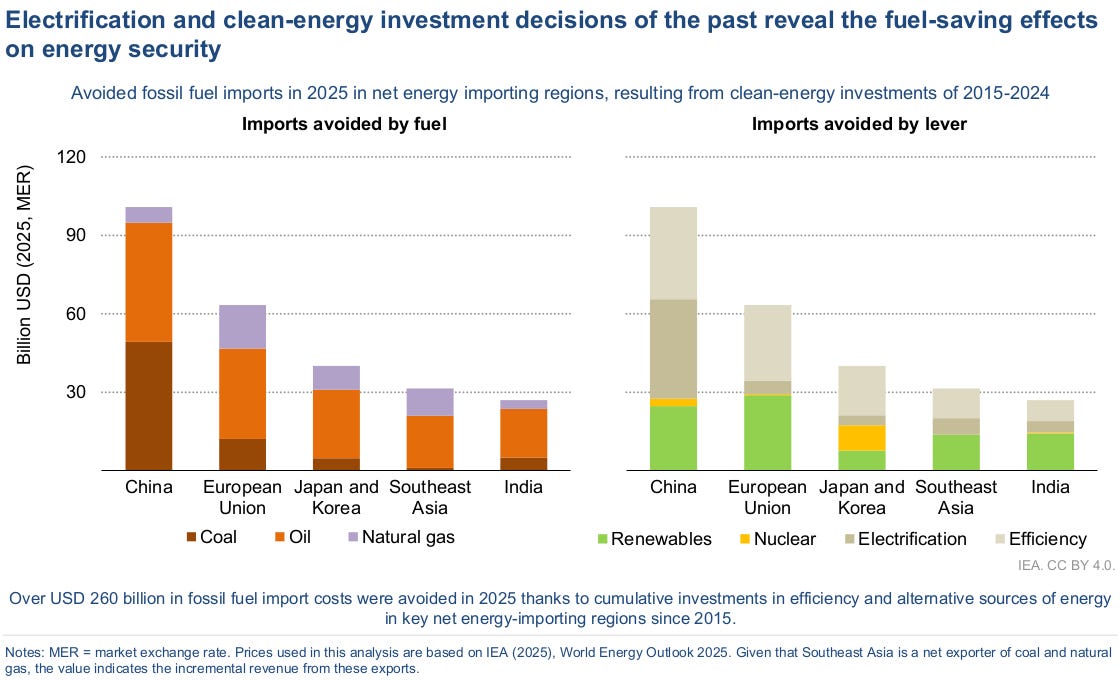
That logic is pointing the world to one direction: electricity. An electrified economy doesn’t perennially wait for fuel to reach its borders. It is already saving the world hundreds of billions in import costs. Which is why close to 60% of all energy investment in the world now goes into electricity in some form — generating it, moving it, storing it, or running things on it.
The recent Hormuz crisis has given this trend wings. As oil prices jumped this year, interest in electric vehicles climbed across the world — from the European Union to Vietnam. Countries like Japan and Korea, which import nearly all their fuel, are now putting public money into electrifying buildings and heating. They’re selling this to voters as national security, not climate policy.
As the IEA warns, however, electrification doesn’t end a country’s dependence on the outside world. It only changes how that dependence looks.
Electric dependencies
An economy that runs on oil has to keep buying oil, often from far away.
An electrified one, meanwhile, has to get two different things right: it needs to spend a large amount of money upfront, and it needs to source a steady supply of manufactured hardware — solar panels, batteries, transformers, and other equipment that makes up a grid. If those are built and paid for, running costs drop and the fuel risk mostly goes away.
That comes with its own hurdles, however.
The first is manufacturing. As we harp about endlessly on The Daily Brief, most of the world’s electrification hardware is overwhelmingly made in China. The country accounts for ~85% of the world’s solar manufacturing capacity, ~80% of its lithium-ion battery production, and ~95% of the capacity to make the wafers that go inside solar panels. It also controls more than 70% of the market for 19 out of the 20 minerals the IEA considers strategic.
No single oil producer in the world enjoys anywhere near this level of dominance.
The second hurdle is money. Clean power is capital-heavy and front-loaded. Almost all of your investment is compressed at the very beginning, while the savings only trickle in over decades. This makes electrification unusually sensitive to the cost of borrowing. If money is hard to raise at the time infrastructure is being set up, the future earnings it could bring matter for little.
As our technology improves, the burden drops. Over the past decade, the cost of solar panels, batteries and electric vehicles fell by roughly 80%. Without these advancements, our current pace of electrification would cost twice as much.
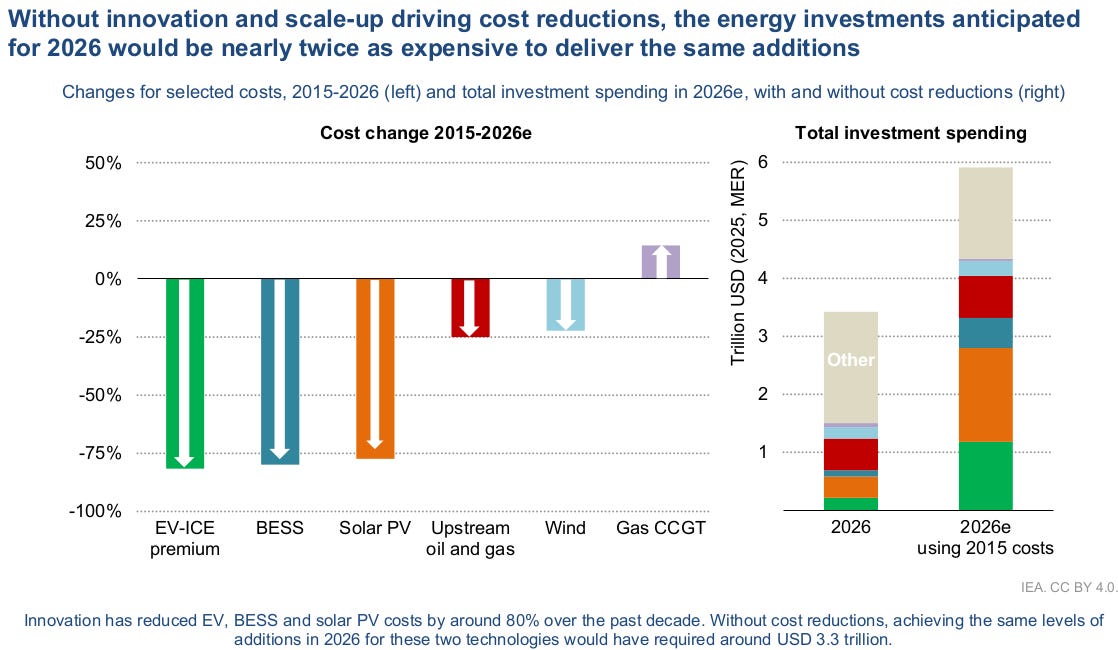
And yet, it is still not in everyone’s reach. Even if the equipment is cheap, if the loans needed to install it cost 12% a year, many are still unlikely to invest.
That’s the deep irony of our moment. Electrification was supposed to be a great leveller: the sun and the wind fall on everyone, unlike oil, which sits under a lucky few countries. But the things that turn sun and wind into electricity — capital and factories — are even more concentrated than oil ever was.
Who can actually afford it
This has done something odd: there are few countries that can actually afford to make this switch, and they’re those that need it the least.
A solar project in a rich country can be financed at a single-digit rate, often in the mid-single digits. The same project in India, Brazil, Indonesia or South Africa carries a cost of capital closer to 9 to 13%. In much of Africa, it runs above 20%. These higher interest rates add a recurring cost to the entire lifetime of a project, even though most investments are made upfront.
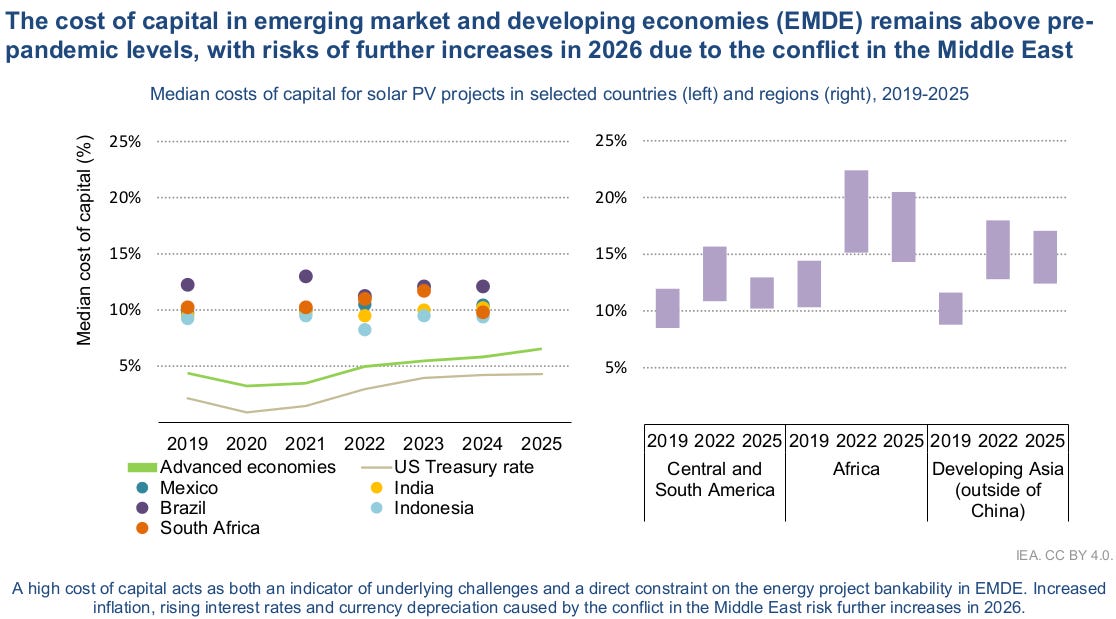
As a result, places that have the most to gain from cheap, home-grown power are exactly the ones for whom it’s the most expensive to build.
Funding constraints
That gap is getting harder to cross. For one, the world is becoming reluctant to give these projects patient capital, instead tilting towards debt. While energy-related borrowing rose about 10% last year, projects funded out of equity, grants or subsidies edged down. The world is also doing away with the “green” premium it would once give electrification projects, shaving off some of their cost. The market for sustainable-labelled debt actually shrank about 14% last year, as lenders went back to judging projects on their economics rather than branding. And the philanthropic money that once backstopped risky projects in the poorest markets has thinned to a trickle.
Instead, the capital for green infrastructure increasingly sits with a handful of very large institutions — pension funds, insurers, and asset managers. These now hold close to 30% of the biggest listed state energy companies and more than 85% of the largest private ones. These institutions chase low-risk returns, and are unlikely to fund moonshot projects somewhere in the developing world.
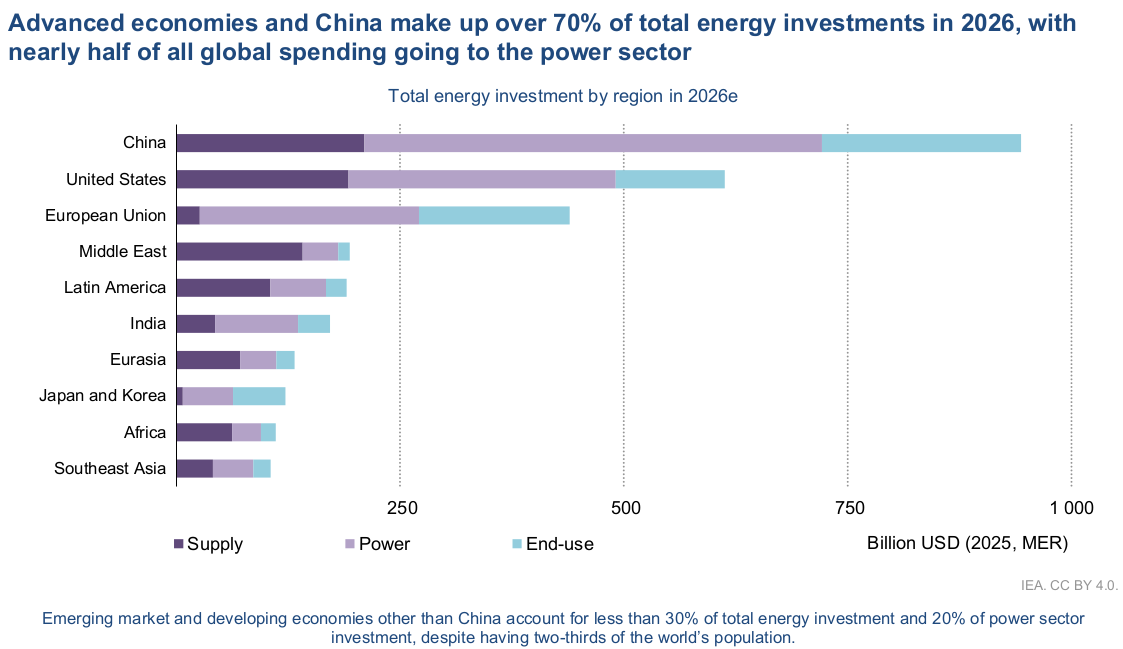
The result: China, the United States and the European Union account for about two-thirds of the world’s clean-energy investment. The rest of the world gets under 30% of its energy investment.
That has interesting knock-on effects. In a situation like the Hormuz crisis, countries that could already raise the money for green projects were the most capable of displacing its effects. Meanwhile, those most exposed to swings in fuel prices have the least capital to climb out of that exposure.
How much does a percent cost?
How does the developing world break out of this grid-lock?
IEA points to one idea: capital recycling. If developers can sell or refinance their finished, working projects, that could free up money for new ones. The same equity, then, can build several things over time instead of just one.
This is already happening in the richer world. There, the market for buying and selling operating projects grew from around $220 billion in 2013 to roughly $960 billion a decade later. But once again, in the developing world — which needs this kind of secondary market the most — it barely exists. And without buyers for finished assets, money stuck in one project never reaches the second.
This might sound dry, but consider this: if the cost of capital in developing economies comes down by a single percent, their yearly cost of financing their clean power and electrification falls by about $30 billion by 2035.
A return to fossils?
Paradoxically, meanwhile, a moment like this pushes them further into coal and gas.
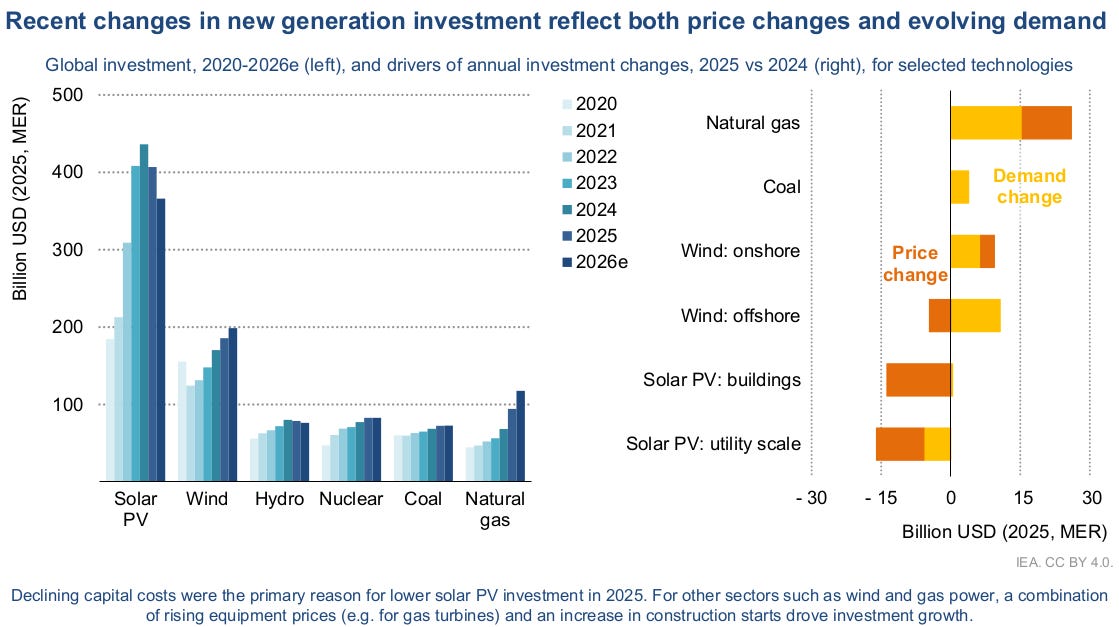
Take coal. As recently as the beginning of this year, it seemed like coal would soon cease to be the world’s energy backbone. But the world has suddenly learnt just how unstable its oil supplies were, while green energy projects are unaffordable. At the moment, therefore, coal is being recast across much of Asia as a security asset. It is easy to find, plentiful, and relatively immune to the wrath of Hormuz-like chokepoints. The world’s coal supply investment is now at its highest in more than a decade, at around $180 billion.
Meanwhile, investment in natural gas supply is at a ten-year high as well, but for very different reasons. This isn’t just an outcome of capital starvation — the United States, the world’s richest country, is ordering gas-fired power plants at the fastest rate in 25 years. Much of it is meant to feed the surging electricity demands of AI data centres. In just the last year, the country has placed ~$24 billion worth of gas-related orders for data centre projects alone. If American data centres were a country, they would be the world’s second largest destination for gas turbines. The timeline for AI demand is simply too short for grids and clean plants to catch up.
And so, in a moment that’s pushing the world towards electrification, paradoxically, fossil fuels have suddenly had a second wind.
India, with both hands
India sits in an awkward spot through all this.
We’re too big, and growing too fast, to stay still. Our appetite for energy is growing faster than almost anywhere on earth — with our total energy spending rising about 11% a year. We’re too short of cheap capital to outspend the problem. We can’t lean fully into clean energy, because that requires money we can’t afford, and hardware imports from China, who we don’t fully trust. And yet, we can’t afford to stand still either. Structurally, we need much more energy than we currently make.
And so, we do both.
As we recently covered, we’ve built out so much green energy infrastructure recently that our raw capacity for generating energy isn’t our biggest problem any more. Our bigger bottleneck, now, is finding a way to absorb all that energy. Some of our biggest investments are in things like the grid and batteries. Off late, even tenders for solar and wind energy are paired with storage — so that our energy can be made reliable around the clock.
But we’re hedging this with a massive build-out of refineries. We’re increasingly a maker and exporter of finished fuels, capturing value and supply that would otherwise sit abroad. This naturally deepens our need for imported crude. But when the alternative is expensive finance and a dependence on China, oil can actually become insurance.
We have to fend off two risks at once: the risk of being shut out of the clean future, and the risk of being caught short in the fossil-based present.
India’s Missing Poor
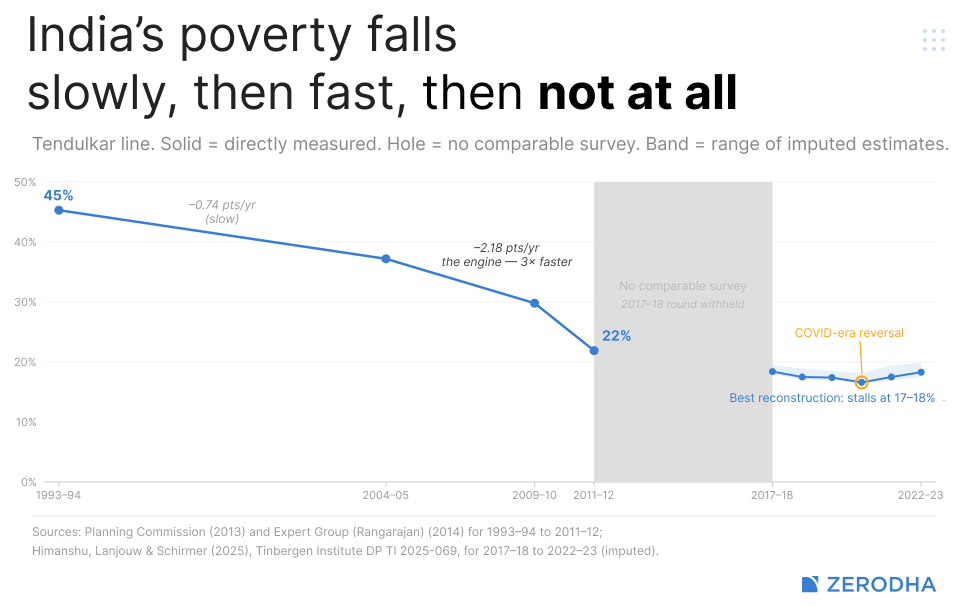
Between 2004 and 2011, India pulled off something rarely seen in the world. Our poverty rate fell from 37% to 22%. Every single year, we would drop more than two percentage points. That is, every year, one in fifty Indians — tens of millions of people — would break out of poverty.
And then, for about a decade, we struggled to even count how many poor people we had.
Our economy kept growing through this period. Our GDP per capita rose by over 4% a year for the entire decade. By any normal logic, poverty should have kept falling, maybe even at a faster rate.
But, did it? That’s a hard question to answer — because we simply stopped counting.
But there’s some indication to be found in a 2025 Tinbergen Institute discussion paper, authored jointly by researchers at JNU, and the Vrije Universiteit in Amsterdam. The three of them set out to reconstruct what happened to Indian poverty after 2011, a period when the data had a hole in the middle.
How do you count poverty
India counts its poor the simplest way imaginable: surveyors knock on doors and ask what a household spent last month. They then add up the answers, draw a line, and count who falls below it.
One of these surveys was due around 2017. Although the survey itself happened, the government refused to release the results, citing concerns about data quality. And so, for roughly a decade, India had no official, trustworthy consumption numbers at all.
There were some leaked tabulations, though. According to the economist S. Subramanian, they pointed to something unfortunate: poverty, it appeared, may have ticked up slightly between 2011 and 2017.
A new survey finally arrived in 2022 and 2023. On the surface, it suggested a dream headline: India’s poverty had fallen 29.6% to 7.2%. That is, in a decade, poverty had fallen from nearly one in three Indians to barely one in fourteen.
This didn’t settle things, however, because the survey changed how it measured people’s consumption. The new survey used a different recall method from the one in 2011, with different time windows for different goods. Surveyors now visited each household several times instead of once. They bundled the items differently, added new ones, and began putting a value on goods people received for free.
This wasn’t a conspiracy; in fact, many of these were genuine upgrades. But when you overhaul a survey like this, ordinarily, you run a small bridge survey alongside it, done the old way, just once, so the new numbers can be lined up against the past. That step was skipped, and with that, we lost the ability to compare ourselves against older figures.
Even though we had new numbers now, these changes made them incomparable with older surveys. You could tell how people responded to the new survey, but you couldn’t tell if there was real change in people’s lives, or if the new methods simply gave different answers.
There was also a third problem: nobody agrees on the poverty line.
You can think of a poverty line as a cutoff. Spend less than Rs. X in a month and you’re counted as poor. Spend more and you’re not. India has two of them, drawn by two different government committees. The lower of these, and therefore the one that’s harder to be considered “poor” under, was the “Tendulkar line”. By that line, 22% of Indians were poor in 2011. The Rangarajan line sat higher, considering more people as “poor”.
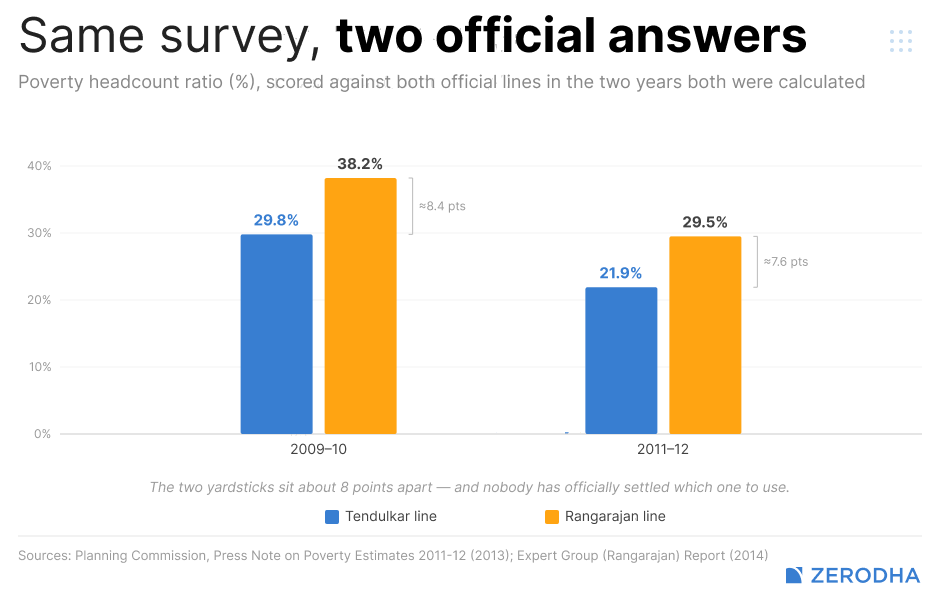
Effectively, even if we had spending data from every single person in India, we wouldn’t know exactly how poor people were.
With these problems in the data, all one could tell was that our level of poverty had moved. Only, it was much harder to estimate exactly how much it moved by. For that, we would need something more creative.
Filling in the blanks
To get around our many data challenges, the researchers attempted something called “survey-to-survey imputation” — a method that one of the same researchers had discovered previously.
Instead of comparing spending, which the two surveys measured differently, they only looked for those things both surveys measured the same way. Both had household sizes, years of schooling, what kind of work people do, what they own — a fridge, a two-wheeler, a phone — and so on. That gave you a pattern: a household that looked a certain way tended to spend a certain amount. If you applied the pattern to the new survey, you could make an educated guess on what those households would have spent, counted by the old method.
The authors then ran the model a thousand times over, giving them a proper range, instead of one fragile guess.
In a richer version of the same exercise, they also tracked patterns alongside results from labour force surveys we carry out every year, getting a richer year-by-year picture rather than one frozen frame.
Now, this method isn’t magic, as the authors themselves admit. There’s no guarantee that a statistical relationship from 2011 has any meaning today. They did test it backwards — between 2004 and 2011, for when we had good data. There, it tracked reality quite closely. But anything could have broken that correlation in the following years.
This is a reconstruction. It is imperfect. But it does offer some sort of bridge between two data series with a massive gap in between, where none existed previously.
The answer
This exercise gave the researchers a range.
The quick method, that simply compared the two surveys, showed a drop in poverty from 22% to around 11-14%. In the richer method, which also used jobs data, the decline was less steep still — dropping to ~18% by 2017, and then hovering at 17-18% through to 2022.
This is all, incidentally, under the Tendulkar line. The stricter Rangarajan line gives a poverty rate somewhere in the low twenties.
A common finding that runs across is that our rate of poverty decline has slowed down. Against our old pace, where poverty came down by 2% every year, the pace fell to less than 1%, if not lower. In fact, chances are, we saw a quick enough decline until around 2017, but it stalled there — and some of our gains were wiped away in the COVID years of 2020 and 2021.
An uneven map
This, however, is a national average. Underneath, they found a wildly uneven map, with different parts of India seeing completely different fates.
Uttar Pradesh, India’s largest state, stands out with a clear and real fall in poverty across both villages and cities. In its immediate neighbourhood, though, the picture was very different. Bihar barely budged. Jharkhand and Madhya Pradesh weren’t much better off either. Whatever worked in UP wasn’t happening around it. That gap wasn’t some quirk of measurement; it was clearly a matter of policy.
Poverty reduction in Maharashtra and Andhra Pradesh, too, flatlined. In fact, in some states that already had low urban poverty, urban poverty actually crept up.
Villages and cities, too, saw very different fates. Rural India saw the bigger drop from 2011. At the same time, it also took the post-COVID hit. The bounce-back in poverty rates after 2020 is mostly a village story.
Meanwhile, cities improved less, and more unevenly. But they also held onto their gains through the pandemic.
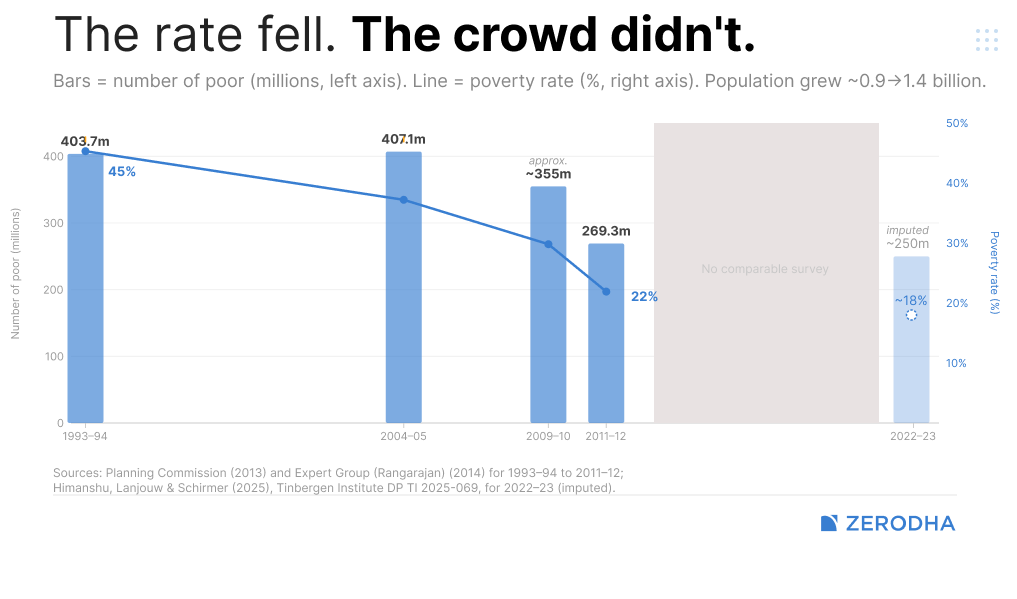
One of the challenges with India’s poverty reduction is simply our size. Our population went from about 1.26 billion in 2011 to 1.43 billion in 2022 — with hundreds of millions of new people. Even when the poverty rate fell, the number of poor Indians barely saw a dent, dropping from ~270 million to maybe 250 million.
Why did we falter?
The paper doesn’t attempt to tell one what happened. After all, it’s a measurement paper. It’s trying to get the number right, not to explain it.
Here is our speculation, though: detached from the paper’s findings.
The last decade has shored up serious headwinds that were beyond anyone’s control. COVID was a real external shock. In the years since, the world has been through a wider slowdown that no single country fully controls. None of this is good for an economy.
But there are clearly choices involved.
Consider the state gap. Why does UP pull ahead when Bihar — a culturally similar state that sits just next to it — cannot? Things like this signal that governance and state-level policy matter.
As we recently covered, some of this ties back to India’s broken labour markets, where real wages for unskilled workers have gone nowhere for years, while people are sliding back into low-paid farm work because the factories never showed up.
Many Indian economists — like Mody, or Ghatak and Kumar — have been making a similar point: that our headline GDP growth may overstate how good things really are on the ground. This new paper certainly gives them some firepower.
Good statistics are infrastructure
There are other choices worth thinking about, though.
Holding back the results of a survey is a choice. As was the lack of a bridge between our older consumption figures and the newest set.
That, more than any single figure, is the real story. You might have whatever beliefs you do politically. You might completely disagree with their reading on India’s poverty rate. But it is unfortunate that a country of India’s stature doesn’t have detailed numbers on its own consumption, or that researchers have to reverse-engineer it with clever statistics out of a university in Amsterdam. That is a failure of our statistical plumbing.
Good official statistics are infrastructure, as basic as roads or electricity. When they break down, everyone argues past each other with their own favourite numbers, while the truth dies a lonely death in between.
Tidbits
[1] Govt to unveil coal-based urea policy within a month
The government is finalising a new policy to promote coal gasification-based urea production, aiming to reduce dependence on imported natural gas and improve fertiliser self-sufficiency. The move has gained urgency amid global energy supply concerns and growing industry interest in coal-based urea projects.
Source: BusinessLine
[2] IBC has helped creditors recover over ₹4 lakh crore
Creditors have realised more than ₹4 lakh crore through resolutions under the Insolvency and Bankruptcy Code (IBC), while over 30,000 cases involving ₹14 lakh crore were settled even before formal admission. The government says the IBC has significantly improved creditor-debtor discipline and accelerated resolution of stressed assets.
Source: BusinessLine
[3] West Asia conflict could slow growth and lift inflation: SBI Chairman
SBI Chairman C.S. Setty warned that the ongoing West Asia conflict could weaken global growth, raise energy prices, and push up inflation. While India remains relatively resilient due to strong domestic demand and public investment, prolonged disruptions could weigh on FY27 growth and inflation.
Source: Economic Times
- This edition of the newsletter was written by Pranav and Bhuvan.
What we’re reading
Our team at Markets is always reading, often much more than what might be considered healthy. So, we thought it would be nice to have an outlet to put out what we’re reading that isn’t part of our normal cycle of content.
So we’re kickstarting “What We’re Reading”, where every weekend, our team outlines the interesting things we’ve read in the past week. This will include articles and even books that really gave us food for thought.

Rosa & Tamoghna on India’s Youth Employment Crisis
In India, the more educated you are, the more likely you are to be unemployed. Graduate unemployment among the youth sits at 40%. For those with no education, it’s 3%. We recently spoke to Rosa Abraham and Dr. Tamoghna Halder, two of the authors behind the Azim Premji University’s State of Working India 2026 report, to understand why. Our conversation goes into what’s really driving this paradox — the role of caste and social signalling in education choices, whether waiting for a good job is rational, why the “missing middle” of Indian firms matters, and what the demographic dividend window really means for policy. Do give it a listen!
Thank you for reading. Do share this with your friends and make them as smart as you are 😉
Interesting read!
Nice read :)