
The stitch that doesn't hold


Our goal with The Daily Brief is to simplify the biggest stories in the Indian markets and help you understand what they mean. We won’t just tell you what happened, we’ll tell you why and how too. We do this show in both formats: video and audio. This piece curates the stories that we talk about.
You can listen to the podcast on Spotify, Apple Podcasts, or wherever you get your podcasts and watch the videos on YouTube. You can also watch The Daily Brief in Hindi.
The Daily Brief is stitched together by a tiny team, and as the year comes to a close, we’re taking a short breather to reset and recharge.
From December 26 to December 31, we won’t be running editions of The Daily Brief. Instead, however, we’ll introduce you to the people who run our writing room: those whose words you read here every day.
Our usual programming returns on January 1!
In today’s edition of The Daily Brief:
Your friendly neighbourhood “Tailor”
Why the GDP is a story, and base years matter
Your friendly neighbourhood “Tailor”
From t-shirts in Walmart, to towels to Target, to denim to European fashion houses, India is a textiles exporting powerhouse. However, in contrast to this success, large swathes of India’s garment sector are informal. One in six manufacturing workers in the country is a tailor working alone, stitching clothes for neighbours and local customers. And they work informally, with no contracts and no social security.
There are ~12 million custom tailors in India. In comparison, the entire IT services industry, a behemoth of the Indian economy, employs around 5.4 million.
Imagine, on one end, export-focused garment factories in Tiruppur and Bangalore, stitching thousands of t-shirts for global brands. But, at the other end, tailors in mohallas work from small shops or the corners of their huts, making one salwar suit at a time. Both count as manufacturing workers, but inhabit entirely different economic worlds.
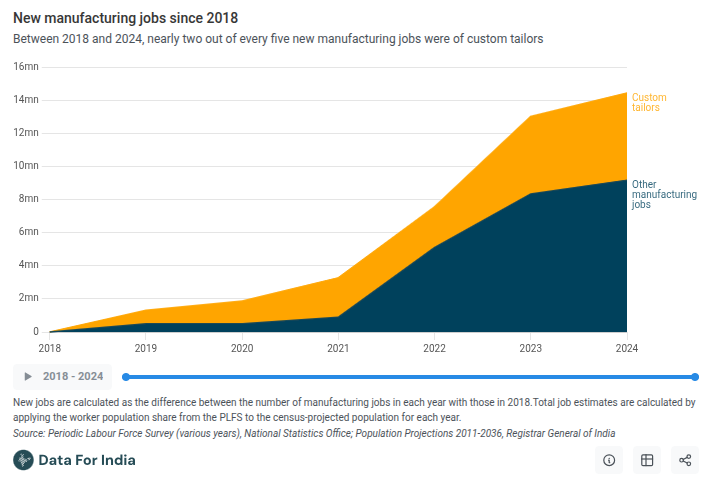
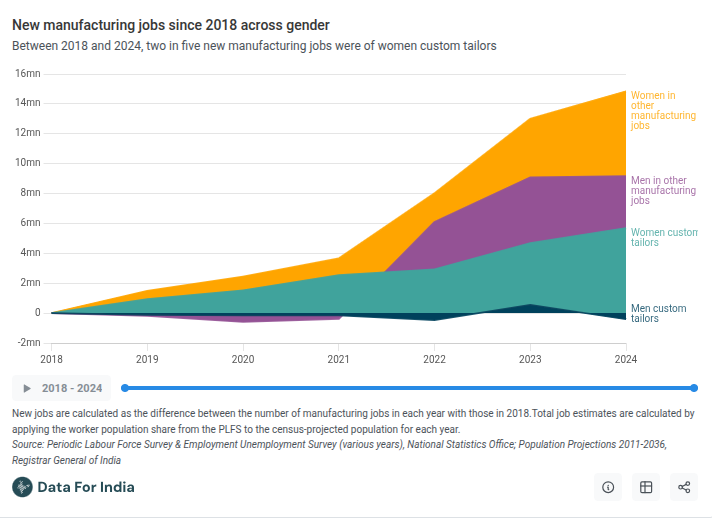
And this distinction may not be disappearing anytime soon. Between 2018-2024, India added roughly 14 million new manufacturing jobs, more than a third of which were in custom tailoring. In fact, these tailors do count as “manufacturing workers”, but they do not add to India’s “manufacturing value added” at all.
So, why are so many people working as informal custom tailors? What are the structural reasons for why this exists, and what does it mean for the Indian economy? We decided to do a story based on the data assembled by the fantastic team at Data For India.
A safety net when there’s no other
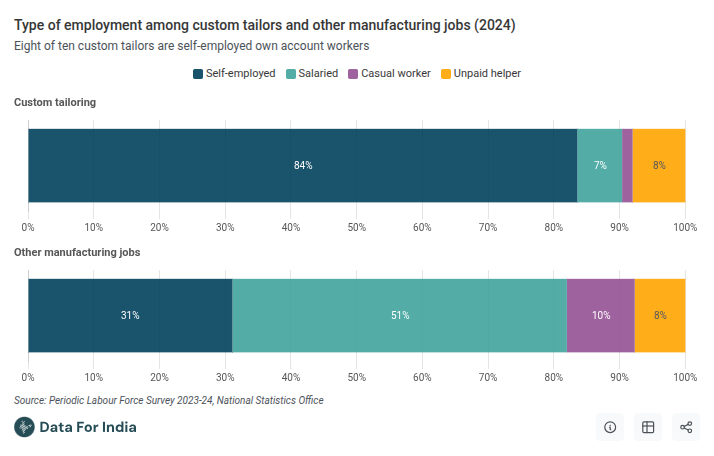
Now, tailoring isn’t really a career aspiration for anyone. It’s what people do when better options aren’t available. The barriers to entry are low — all you need is a sewing machine, basic skills learned through family or apprenticeship, a small space to work. In fact, over 80% of tailors have never received vocational training.
The earnings reflect this, too. Eight in ten self-employed tailors earn around ₹6,000 per month — less than half of what other self-employed manufacturing workers make. Work is seasonal, concentrated around festivals and wedding months. Diwali sees steady periods, but is then followed by lean periods with barely any customers.
This doesn’t really resemble entrepreneurship, but rather more disguised underemployment. People are working, so they don’t show up in unemployment statistics. But they’re in low-productivity, low-earning activities that absorb labour without generating much economic value. Tailoring has grown not because demand for custom clothing is booming, but because it serves as a fallback when the formal economy doesn’t create enough jobs.
How custom tailoring became informal
The nature of informality in this sector wasn’t accidental, but rather shaped by decades of policy choices.
After independence, India focused on building steel plants, dams, and heavy machinery. Consumer industries like clothing were seen as low priority. Large garment factories faced strict labour laws and licensing requirements. Small tailor shops were simply ignored — no support, but no scrutiny either.
From the 1960s, the government reserved garment production for small firms to protect local entrepreneurs. But this created a problem. If a tailor hired more workers or expanded beyond a certain size, they would lose tax benefits and face heavier regulations. Growth was penalised. So tailors learned to stay small — don’t hire too many people, don’t register formally, don’t become visible.
When India’s garment industry finally boomed in the 1980s and 1990s, it was built around exports. Factories produced standardised t-shirts and trousers for Western brands. These factories hired young, mobile workers and trained them for assembly-line production. But they had little use for traditional tailors — older, self-taught, used to working independently. And they weren’t making custom-fit clothes for Indian customers. That demand stayed with the neighbourhood tailor, working informally as always.
Then came 1991. The economic reforms let companies expand freely, but labour laws stayed rigid. Hiring was expensive, while firing was legally difficult. Garment exporters responded by keeping formal workforces small, while subcontracting home-based workers and tiny workshops to do their stitching work.
Independent tailors survived by pivoting. They moved to where factories would find it hard to follow. For instance, in women’s ethnic wear, where fit is individual and design is custom, mass production based on standardized designs may not work as effectively. Ready-made options exist, but they often need alterations, which brings people back to the tailor. In fact, an argument can be made that this shift itself created new niche export markets that small units cater to. In fact, a huge chunk of Indians still wear stitched clothes in some form.
Additionally, since labour is comparatively cheaper in India, custom stitching is affordable in ways it isn’t in richer countries. Spending time on a tailor visit then becomes a rational trade-off.
Now, how is the output of the custom tailoring industry measured?
Custom tailoring generally counts as manufacturing employment, since tailoring transforms raw material into a finished product. But in India’s national accounts, the economic output of tailoring is classified under services, not manufacturing. The logic is that tailors don’t own the raw material. A customer brings fabric, the tailor stitches it for a fee. That makes it a service rendered, not a good produced.
The next time you see a headline about India’s manufacturing workforce growing, remember that there is a chance that it might merely be a headline number. Rising manufacturing employment may look like industrial growth. But a big chunk of that rise is low-productivity, informal, home-based tailoring. The jobs are real, but they’re not the kind of factory employment that drives productivity growth. India is creating manufacturing workers without necessarily creating manufacturing output.
Why women dominate this sector
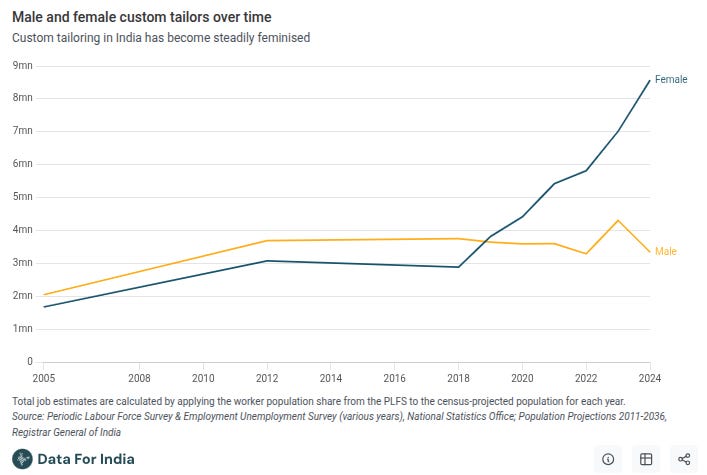
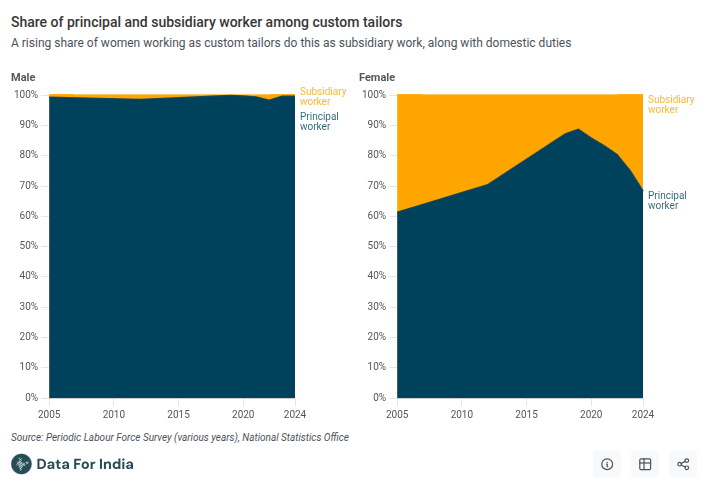
This informality is not evenly split across genders, either, as women occupy a majority share of the jobs than men. In 2005, about 45% of custom tailors were women. By 2024, that share had risen to 72% — roughly 8.5 million. One in three women working in manufacturing is a custom tailor.
Between 2018 and 2024, of the 10 million women who entered manufacturing, nearly 6 million became tailors.
This isn’t just endemic to custom tailoring, though. As we’ve covered before, women make up most of the informal sector employment in India. Apparel and textiles are where this informality is most visible, followed by tobacco (or bidis).
Now, why does this happen? See, tailoring fits around life in ways factory work doesn’t. Factory jobs need fixed hours, daily commutes, working under supervision in a factory at a distant location. For many older women in smaller towns and rural areas, these are often deal-breakers, mostly since they have to care for social norms, (like childcare).
About 90% of women tailors work from home or an adjoining space. Many do it as subsidiary work alongside domestic duties, not full-time. The share doing tailoring part-time rose from 11% in 2019 to 31% in 2024.
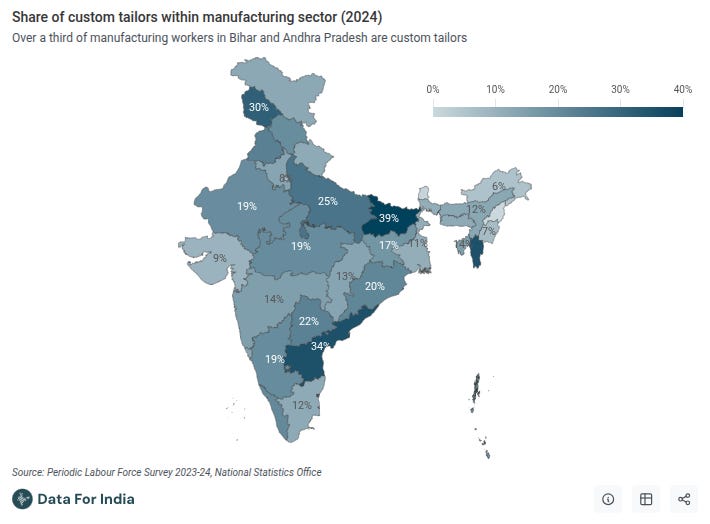
States like Bihar, Andhra Pradesh, and Uttar Pradesh, where formal manufacturing jobs for women are scarce, have the highest concentrations of informal tailoring jobs. In Bihar and Andhra Pradesh, over 30% of all manufacturing workers are tailors. If you remove tailoring from consideration entirely, then women would be 28% of manufacturing workers instead of 35%.
Why formalisation keeps failing
Besides government regulation, have there been any attempts to try and organise this sector?
A few startups, like TailorSmart and CloudTailor, have built platforms connecting customers with tailors, enabling app-based ordering, at-home measurements, and doorstep delivery. For instance, TailorSmart has about 800 tailors across 25 cities and made around ₹1.4 crore last year. However, against 12 million tailors in India, those 800 represent 0.007% of the workforce, a paltry percentage.

Scaling is hard for several reasons. For one, tailoring is a trust-based relationship business. Families stick with a known tailor for years, sometimes decades. The tailor knows their measurements, preferences, quirks. Convincing customers to try a stranger from an app is difficult.
Secondly, traditional tailoring is low-margin. There isn’t room for a platform to take a cut without losing the affordability that makes tailoring attractive.
Third, frequency. Getting clothes tailored isn’t a weekly habit. Most people need a tailor only a few times a year, for festivals, weddings, and occasional replacements. Customer acquisition costs are high relative to usage.
So despite years of effort, the vast majority of India’s tailors remain offline, informal, and independent. Platforms have found some traction in cities, but they haven’t transformed the industry.
What happens if this breaks
Custom tailoring is an implicit safety net for millions of Indians who don’t have any other recourse to a better standard of living. Moreover, ethnic wear still needs custom fits, and body diversity makes standardisation hard. This cannot yet be catered to by mass production, but small-scale units have oriented their business to do just that. Alterations alone will sustain a tailoring industry even if new stitching declines.
But the sector is more fragile than it looks. Ready-made clothing is reaching deeper into smaller towns. Younger generations are less attached to tailored outfits. Many tailors are aging, and their children are choosing different paths. If tailoring were to decline significantly, where would these workers go?
India’s manufacturing story still depends on millions of people stitching clothes one garment at a time in corners of their homes. While that may not be the most efficient use of effort, it is much better than the alternatives. What happens when that’s no longer enough is a question we’re yet to answer.
Why the GDP is a story, and base years matter
There’s been a lot of controversy, over the years, around how India measures its GDP. The latest round of controversy followed the IMF’s recent “C” grade for how India prepares its national accounts. It’s probably not the last.
There is real merit to some of those complaints. But it’s a little too easy to make them the subject of an ugly political slugfest. Reality, meanwhile, is nuanced. Once you see the GDP enumeration exercise for what it is, it’s harder to offer simplistic answers about what’s happening.
To begin with, consider a simple fact: there is absolutely nobody, in India or abroad, who can tell you what our exact GDP is. How would they? Our “GDP” tries to measure every single Rupee in economic value that was created in our economy — from every ten rupee cup of chai to every multi-million dollar space rocket we made. Unless someone could keep an eye on everything, everywhere, all the time, counting it all would be impossible.
The best you can do is get a good estimate. Every GDP figure is a story; the only thing worth asking is whether that story rhymes with reality — and if it doesn’t, why not.
The impossibility of measuring our GDP
Where does one even start counting the value an economy created?
Imagine a simple economic chain:
A farmer sells wheat to a mill, for ₹60.
The mill turns it into flour, and sells it to a bakery for ₹100.
The bakery turns flour into bread, and sells it for ₹140 to households.
In all, ₹300 changed hands over this time. But how much value was created?
There are, broadly speaking, two ways of answering that question:
One, you look at the production that’s happened here. You can go to each stage of the chain, estimating the output each one created. Here, the farmer brought ₹60 of value to the mill; the mill added another ₹40 while turning it into flour; and the bakery added an extra ₹40 of value while turning that flour into bread. In all, the system generated ₹140 in value.
Two, you look at the final expenditure that happened down the line. The final consumer paid ₹140; which is the ultimate value this chain created.
In the actual world, economic chains are infinitely more complex, and you don’t have nearly as much clarity around how each transaction went. But we estimate the value created by our economic system in roughly the same way.
We have some datasets that can tell us the amount of value different industries create — like tax data, or corporate filings, or industry-wide surveys. Put all that together, and you can estimate the country’s GDP using the “production method”. Meanwhile, we have other datasets that tell us what different “final consumers” in our economy are spending — like household consumption surveys, government books, trade statistics, and more. Process them all, and you can get to our GDP using the “expenditure method”.
There’s also a third way, called the “income method”, but we don’t use it much in India.
In an ideal world, where everything was measured perfectly, all these methods would converge on exactly the same answer. That’s not the world we live in, sadly. There are many little imperfections in how these datasets are put together, and many complications in how we fit them all together. All of this introduces some error into our national statistics.
The only question is how much error are we willing to live with.
You don’t even have a good scale
One of the biggest sources of distortion is that we don’t have a scale to measure our economy with.
We usually observe our economy in terms of how many rupees it creates. Over long periods of time, though, forces like inflation change the rupee itself. Imagine, you run a business that made ₹4,000 in sales last year, and ₹5,000 in sales this year — but the rupee fell in value by 7% during the same time. How much more business did you actually do? Complicated, isn’t it?
Trying to track your GDP figure is a little like trying to track your weight over time, only to find that the definition of a “kilogram” keeps changing. You could know exactly how many rupees an economy created yesterday, and how many it created today, and you might still not know which is larger.
So, here’s what you do: first, you come up with the absolute value of what the economy has produced: what’s called the “nominal GDP”.
To make this number meaningful, though, you then lock in a specific value for the rupee — pegging it to where it was at some “base year” in the past. Right now, for instance, our GDP figures are tied to where the rupee was in 2011-12. With that base year in hand, you can calculate how much inflation has happened since, and adjust your nominal GDP accordingly. This brings us to the “real GDP”.
This “base year” also informs many other ways in which we interpret our economic datasets.
Deflation sometimes makes no sense
Much like “GDP”, inflation is ultimately a story. It’s a single number that’s trying to make sense of a million different price fluctuations. To get to that number, we create an artificial “basket” of items one might want to buy — how much food they would buy, how many clothes they would buy, how much they would spend on movie tickets, and so on — and track changes in its price.
This number is, at best, an incredibly rough estimation of how much inflation there is. Nobody can tell you the actual number. And as you move further and further away from the “base year”, the rougher this estimation gets. If 2011-12 is your base year, for instance, you’ve basically selected a basket around what people used to buy in 2011-12. If people’s preferences have changed completely — let’s say, they buy half as much food and twice as many clothes — what you’re measuring might simply make no sense.
And the complications don’t end there. When you start mixing this with the GDP, all sorts of inconveniences pop up:
For one, it’s not always clear what basket you should choose to track inflation. India, for instance, relies heavily on the “wholesale price index” — a wide basket which tracks the prices of important internationally traded commodities. Other major countries use the “producer price index” — which looks more specifically at the prices their specific businesses might need. Both might give you completely different answers.
Different parts of the same value chain could, in reality, “inflate” at different rates. Imagine, for instance, that India’s iron prices grew at 10% across the last five years, but steel prices grew at just 5%. How much value did our steel industry create? You have two choices here. One, you can use “single deflation”: you figure out the rupee value that the industry created this year, and then adjust it for the economy-wide level of inflation. Or, you could use “double deflation”: you adjust iron prices for 10% inflation, steel prices for 5% inflation, and then compare them. We’ve explained this in more detail before. Both approaches measure different things, and would give you wildly different answers.
What measure you use, often, depends on what data you have. If you don’t have granular, industry-wise data, you might rely on poorer data sources, and end up with a very different understanding of how much inflation you’ve seen. And that could completely change your GDP.
It doesn’t end there
This is just one small peek into how hard it is to count our GDP. There are all sorts of other problems we have to live with — cash transactions that are never recorded, businesses that don’t file reliable numbers, sectors where inputs and outputs behave weirdly, and more.
Any GDP number, essentially, is a very complex guess. It runs on many assumptions, and has a lot of room for things to go wrong. This doesn’t mean it can’t be tampered with — you could, for instance, fix a survey in a manner that overstates how much people have consumed. But that said, there are many legitimate reasons for this exercise to be horribly uncertain and confusing.
IMF’s concerns
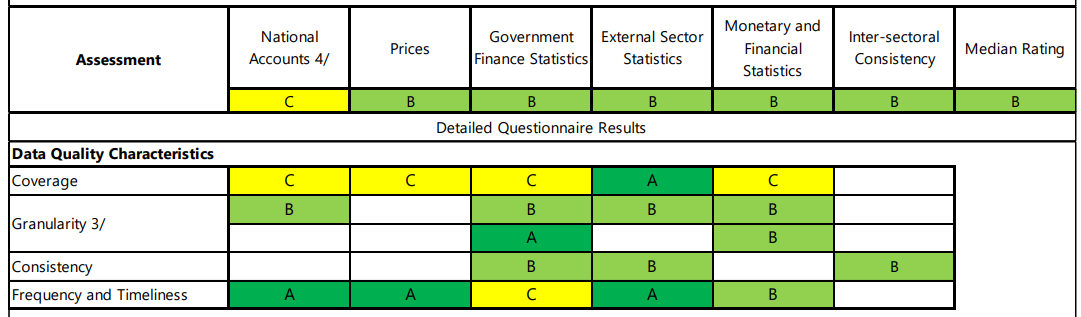
With this in mind, let’s go back to the IMF’s unflattering report card for India. In the IMF’s assessment, India’s overall economic figures earn a “B” grade — with our national accounts, specifically, getting a “C”. Our economic statistics, in its words, have “shortcomings that somewhat hamper surveillance”
This is a signal that the IMF thinks we can do better at a very difficult job. But that’s not the same as believing that everything is fudged.
Here are the actual concerns the IMF has:
Our GDP is still benchmarked to 2011-2012 — a time before major we saw serious economic shifts, like GST, the digital payments revolution, the recent services and tech boom, and more. Our economy has changed a lot over these years. And that means all the assumptions behind our GDP calculations are based on an entirely different economy. Sectors that were booming then are quieter now; and those that power our economy today hardly existed back then. The picture those numbers suggest, then, could be very distorted.
As we noted before, India uses the Wholesale Price Index for deflating large parts of its nominal GDP. This doesn’t actually reflect what our businesses buy, though. For instance, it makes no sense to deflate India’s services businesses for how international commodity prices have moved. Ideally, we should move to a Producer Price Index that is closer to reality.
Similarly, the IMF thinks we would be better off using double deflation, like many other countries.
Some of these oddities mean that, over time, we’re seeing huge gaps in the GDP figures we get using the production method and the expenditure method. These rarely match in the best of cases, but such a huge divergence probably means we’re missing something important.
These are all methodological problems, not allegations of fraud. And India’s government is already planning to change many of them.
India’s overhaul
Over the last few months, the government has been working to overhaul its economic statistics.
The most important, perhaps, is a change in the base year we use for our GDP calculation — from 2011-12 to 2022-23. From February 2026 onwards, starting with the GDP reading for the current quarter, all GDP data releases will be updated to this new base. That is, they’ll reflect a much more updated picture of our economy.
Along with this shift, we’ll also start using many newer, more accurate datasets — like GST data, or digital payments data.
Just as importantly, it will completely change how deflation works in our GDP calculations. The new GDP series will incorporate a Producer Price Index (PPI) for the first time, and adopt double deflation across all sectors. This addresses a massive gap that the IMF has identified.
Along with GDP, we’re also likely to see updates to other datapoints. Our Consumer Price Index, for instance, will see its base year move from 2012 to 2024 — incorporating new insights around how Indians spend their money. For instance, it will reduce how important food prices are to inflation, given that Indians now spend a smaller share of their paychecks on food. Likewise, it’ll remove antiquated goods and services — like horse cart rides or video cassette rentals. Instead, inflation will now measure things like smartphone data plans, or app-based taxi rides.
There are many other changes underway, which we won’t go into right now. Broadly, however, it’s worth noting: barely a month after the IMF’s gloomy report — and all the discussion it triggered — we’re already revamping things, and moving closer to international best practices.
What to expect
If there’s one thing to take away from this piece, it is this: all those clean numbers we see in our economic data are actually extremely messy, once you zoom in. To get to them, we make thousands of calculations across hundreds of datasets. If you change how they work, you should see a mechanical change in the final numbers. That isn’t necessarily a sign of something shady, but simply a change in methodology. It is exactly what the IMF has been asking for.
That said, the government has an important job ahead. This data revision will most probably confuse people, and will most probably create misunderstandings. The last time India changed GDP methods in 2015, it faced a barrage of criticism and doubt. That will probably happen again — especially if, as some analysts suggest, we see an upward bump in our GDP figures.
To get around that, the government needs to do two things: one, it must clearly document exactly what is happening, and two, it must work to communicate it well to the public. That is the only antidote to such trust issues.
Tidbits
India–New Zealand wrap up FTA talks
India and New Zealand have concluded negotiations on a free trade agreement, aiming to double bilateral trade in five years. The deal will cut or remove tariffs on 95% of New Zealand exports to India, while all Indian goods will get duty-free access to NZ. Sensitive items like dairy and edible oils are excluded to protect Indian farmers.
Source: Reuters
Ambuja approves merger of ACC and Orient Cement
Ambuja Cements has approved the amalgamation of ACC and Orient Cement into the parent to create a pan-India cement player. The merger is expected to cut costs, improve margins by ₹100 per tonne, and simplify branding and logistics. Shareholders of ACC and Orient will receive Ambuja shares under a swap arrangement.
Source: NDTV
India’s bare PCB manufacturing set for 45% CAGR surge
India’s bare PCB manufacturing is projected to grow at a 45% CAGR till FY29, driven by electronics demand and government incentives. Domestic output could rise from $0.6 bn to $3.8 bn, cutting import dependence from 88% to 69%. The shift marks India’s move from assembly to higher-value electronic components.
Source: Economic Times
- This edition of the newsletter was written by Vignesh, Kashish and Pranav.
Tired of trying to predict the next miracle? Just track the market cheaply instead.
It isn’t our style to use this newsletter to sell you on something, but we’re going to make an exception; this just makes sense.
Many people ask us how to start their investment journey. Perhaps the easiest, most sensible way of doing so is to invest in low-cost index mutual funds. These aren’t meant to perform magic, but that’s the point. They just follow the market’s trajectory as cheaply and cleanly as possible. You get to partake in the market’s growth without paying through your nose in fees. That’s as good a deal as you’ll get.
Curious? Head on over to Coin by Zerodha to start investing. And if you don’t know where to put your money, we’re making it easy with simple-to-understand index funds from our own AMC.
Thank you for reading. Do share this with your friends and make them as smart as you are 😉
Amazing story
Both stories were interesting and well-written