
The economics of amusement


Our goal with The Daily Brief is to simplify the biggest stories in the Indian markets and help you understand what they mean. We won’t just tell you what happened, we’ll tell you why and how too. We do this show in both formats: video and audio. This piece curates the stories that we talk about.
You can listen to the podcast on Spotify, Apple Podcasts, or wherever you get your podcasts and watch the videos on YouTube. You can also watch The Daily Brief in Hindi.
In today’s edition of The Daily Brief:
The amusement park business is no funhouse
Our economy move in seasons
The amusement park business is no funhouse
We at Markets often decide our stories based on recent triggers, like a new policy, or earnings call, or a recent report, at the very least. Today’s story is different. A couple of mornings ago, we found ourselves talking about amusement parks — reminiscing about school picnics and summer days at water parks.
As we spoke, the questions started piling up. These are all businesses, after all. How do they actually make money? Why do so few of them scale? And why does a country of 1.4 billion still not have anything close to Disneyland?

The more we dug, the more complex the picture got. While visiting an amusement park is one of the most fun, carefree things you can do, running it is anything but. Behind the rides and the wave pools is a seasonal, operationally brutal, capex-heavy business — which is hard to put together, hard to maintain, and hard to stay relevant in.
Let’s take a ride into the industry behind these parks.
What does running an amusement park look like?
To build an amusement park, you start with land—a nice, big parcel that you’re likely to find just outside the city border. Once the land is secured, the spending begins. Concrete foundations, power infrastructure, water filtration plants, restaurants, locker rooms, maintenance sheds, staff housing, and, of course, the rides themselves. A single new park can easily absorb ₹400–700 crores of capex. Even then, the business needs 7-10 years just to recover the investment.
Ironically, the rides are the least Indian part of it all. India doesn’t really manufacture serious, high-thrill machines like roller coasters, drop towers and giant pendulum rides. While some (like Wonderla) do make simple rides in-house, the best attractions are imported from companies in Europe, North America, and Turkey. They come with decades of safety data, metallurgical precision and control systems that Indian OEMs don’t yet have.
Amusement parks are an incredibly seasonal business. Monsoons shut or slow down rides and keep people home. Winters are better in some cities, while worse in others. They work on just a handful of very good months and maybe a few average ones, while in the rest, they hope for the rains to stop.
This shows up clearly in their quarterly results. Q1 (April–June) is usually the best because of summer vacations, Q3 tends to hold up thanks to festivals and holidays, while Q2 — the monsoon quarter — is generally the weakest of the year. In fact, this is partly why water parks are the centre of attraction — they often rescue a bad-weather day.
But the fixed costs of rides often seem too high, even with good footfall. Rides need daily testing, empty-run cycles, inspections, part replacements, lubrication, safety drills, and operator teams on standby. All this adds up to a situation where the fixed costs refuse to shrink even when customers do.
Maintaining these rides is a whole process, too. Each ride has a daily checklist, a weekly shutdown plan, quarterly audits, and sometimes even OEM inspections. Some of this is shaped by some terrible accidents in the past — like the Kankaria pendulum crash in Ahmedabad in 2019, where the main arm snapped mid-air. These mostly happened at travelling fairs with poor oversight, and not large parks. But either way, they shape public fear.
It won’t be a stretch to say that, in many ways, the economics of amusement parks feel like a rollercoaster.
The great Indian consumer
Every amusement park operator in India has to deal with one harsh truth: Indian families love a day out, but they want to squeeze the most value out of every rupee. A family of four may spend around ₹10,000-₹15,000 once you add up tickets, food, transport, and so on. So parks can’t increase ticket prices. If they do so even by ₹50, families might simply postpone the visit, or go to the mall or the movie theater instead.
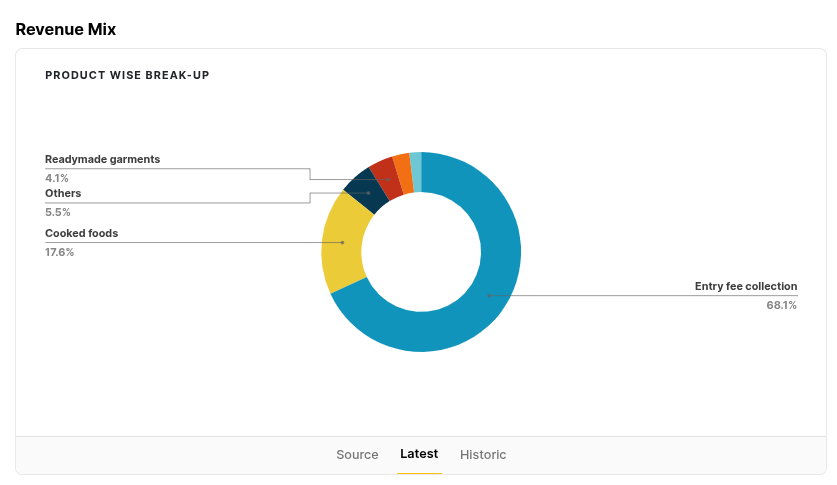
However, for amusement parks, tickets are the economic centre. Wonderla gets roughly two-thirds of its revenue from ticketing. Food, merchandise, and resorts are all marginal in comparison. This means that increasing prices in any lever other than tickets won’t make much of an impact, while ticket prices have a fixed ceiling.
Compare this with global parks, which are built on their own IP. Disneyland enjoys the premium of legendary characters like Mickey Mouse. and even Marvel characters like Captain America. This allows them to not just rely on tickets for revenue, but also merchandise, special events, and even hotels.
But India has no IP ecosystem like that. No Mickey Mouse, Godzilla or Harry Potter that families will pay a premium to meet. Parks here compete on “value for money,” not “world-building.”
A look at the listed players
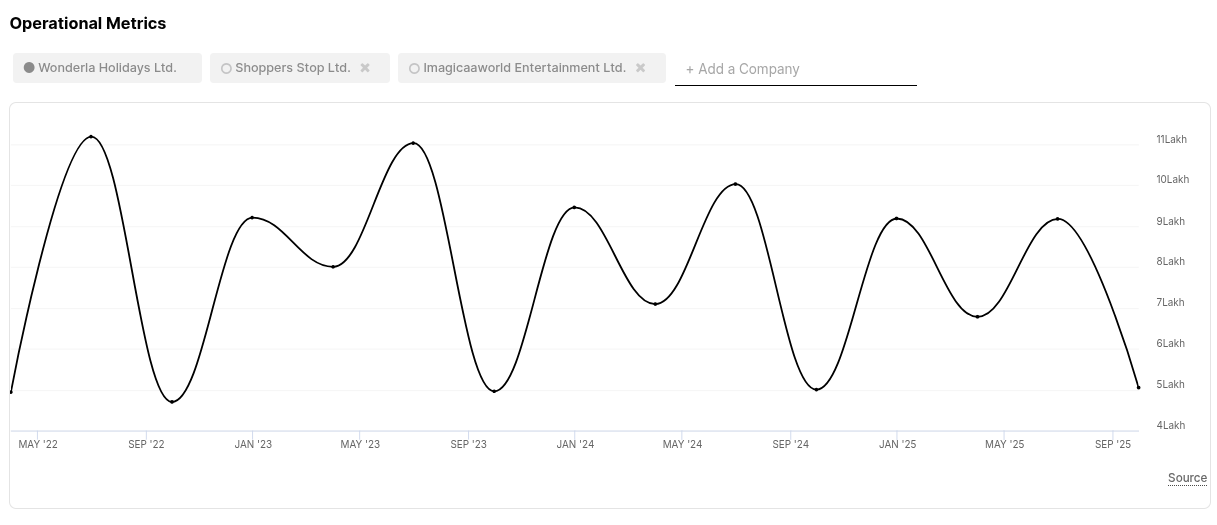
This difference becomes clearest when you look at the two major listed park operators in India: Wonderla and Imagicaaworld.
Wonderla is the steadier of the two. They run parks in Kochi, Bengaluru, Hyderabad, and Bhubaneswar, with a new one opening near Chennai. Their playbook is simple: combine the amusement park and water park into a single integrated experience, keep it clean and safe, keep prices sensible, and build slowly and steadily, one park at a time, mostly through internal reserves. No giant leaps with tons of debt.
Imagicaa was quite different. When it opened in the 2010s, it positioned itself as India’s Disneyland. It had everything: a full-scale theme park, a separate water park, a snow park, a five-star hotel, and elaborate theming. It spent heavily on imported rides and international designers. It aimed for destination tourism.
But three things went wrong:
First, the pricing pushed it straight into the “mini vacation” category instead of a casual weekend plan. Logically, why would you spend ₹40,000 on a single day at a park, when you could just vacation at a nearby beach at similar prices?
Second, its location on the Mumbai–Pune Expressway was far enough from both cities to discourage repeat visits.
Third, it was built on a mountain of debt. When footfalls didn’t rise fast enough, the business stumbled.
Over time, the project ran into financial trouble, went through debt restructuring, and eventually shifted to a new owner, the Malpani Group. Imagicaa still exists today, but more as part of a cluster of regional parks than as the iconic fantasy destination it once hoped to be.
Both companies, in their own ways, explain why Indian parks look the way they do. If you dream too big to build your own Disneyland, you will likely drown under debt and demand mismatch. Dream too little, and you don’t grow. The ones that survive learn to play the middle.
As boring as it sounds, this is also the answer to the question we started this piece with: Why don’t we have a Disneyland? Here’s how Wonderla’s chairman — Arun Chittilappilly — explained it in a Fortune India interview:
“There’s this fantasy that Disneyland or Universal Studios can work in India, but the reality is different. Their scale requires 300 to 400 acres, massive investments of ₹5,000–10,000 crore, and ticket prices upwards of ₹10,000. That just doesn’t fly in India.”
Indian consumers are price-sensitive, but without high ticket prices, world-building becomes impossible. No character lands, no elaborate theming, no expensive souvenirs, no hotels tied to the park’s stories. That entire ecosystem collapses.
Conclusion
If you look at industry reports, the amusement and theme park market in India seems ready for take-off. Depending on the estimate you choose, the industry was around ₹11,000-₹11,400 crore in FY24 and is projected to touch ₹20,500-₹25,000 crore by FY2030. It sounds like a promising 9–11% annual growth rate.
But once you understand how fragile the economics are, those projections start to feel a little too neat. They assume a world where everything goes right, whereas amusement parks are hardly that. The operator is always one heatwave, one monsoon, one ride closure, one safety scare, or one bad pricing decision away from a lost season.
The competition for amusement parks in India isn’t merely other amusement parks. It’s actually everything else a family can do with ₹10,000 on a Sunday. A short trip to a nearby hill station. A day at a mall with shopping. Or maybe, just staying home and saving that money. That is the real competitive landscape.
And even though the space has huge entry barriers, it doesn’t automatically make incumbents comfortable. It only means the risks are different. You don’t fear a new park opening next door as much as a price hike driving people away, or an excessive monsoon.
In the end, amusement parks will always be fun for us visitors. But for the people running them, maybe not so much. It’s a business where every joyful scream from a ride sits on top of five layers of engineering, planning, and risk.
Strangely enough, that makes the business even more impressive. Because behind all the noise and the colour, someone is making sure that joy runs on time.
Our economy move in seasons
Every few weeks, we’re hit with a flood of economic data — inflation, credit numbers, IIP, exports, GDP, and more. These are usually accompanied by frenzied commentary, on how our economy is structurally booming or collapsing. The truth, however, is usually more mundane. The small variations in a lot of these come more from temporary matters than long-term mega-trends.
The RBI, in its November Bulletin, published a research paper that’s basically a cheat-sheat to understand these short-term factors. It pulled together 78 monthly indicators and 25 quarterly ones, and tried to analyse why they move the way they do. Together, these conveyed a picture of seasonality in India’s economic indicators — as things like climate, festivals or even year-end bookkeeping shaped the data.
Once you see those patterns, it’s hard to unsee them. And understanding them is important; once you know the rhythms behind each indicator, you’re less likely to overreact to the spikes, slumps and overall noise in our economic data.
Let’s begin
March: the financial year-end effect
Every year, as March arrives, there’s a visible buzz in economic activity. March is the final month of India’s April-to-March financial year, and that leaves a clear impact on the data. This is when businesses, banks, and government agencies rush to meet annual targets, or close their books. As a result, a host of economic indicators spike every March.
This is particularly visible in banking and finance. As March rushes around, every year, companies draw down their credit limits and park funds. This means banks see a surge in deposits and lending in March. And so, key lending metrics — like bank credit creation, or demand deposit balances — typically hit their high point.
As the demand for loans spikes, banks naturally sell their own investments to gather enough funds. So, you also see a counter-movement in bank’s investment portfolios at the same time.
The government adds to the exuberance. Towards the end of every fiscal year, ministries feel the need to use up their unspent budget allocations before they expire. Not only do those funds disappear if they don’t; their future budgets, too, might be slashed if they can’t spend everything they’re allocated. This creates a surge in spending — adding to the year-end economic bustle.
To add to all this financing activity and government demand, manufacturers themselves have an incentive to produce as much as they can and complete pending orders before March ends, so that any revenues they realise appear in that year’s financials. This adds to the activity in allied sectors as well — electricity, for instance, sees a brief surge in March, before a much larger jump every summer. Similarly, there’s more demand for raw material — bringing a yearly surge in mining, or segments like steel and cement.
This heightened activity all shows up in production and trade data mirrors the scramble. For instance, the Index of Industrial Production (IIP) — a monthly measure of the growth in India’s industrial sector — shows a consistent jump every March.
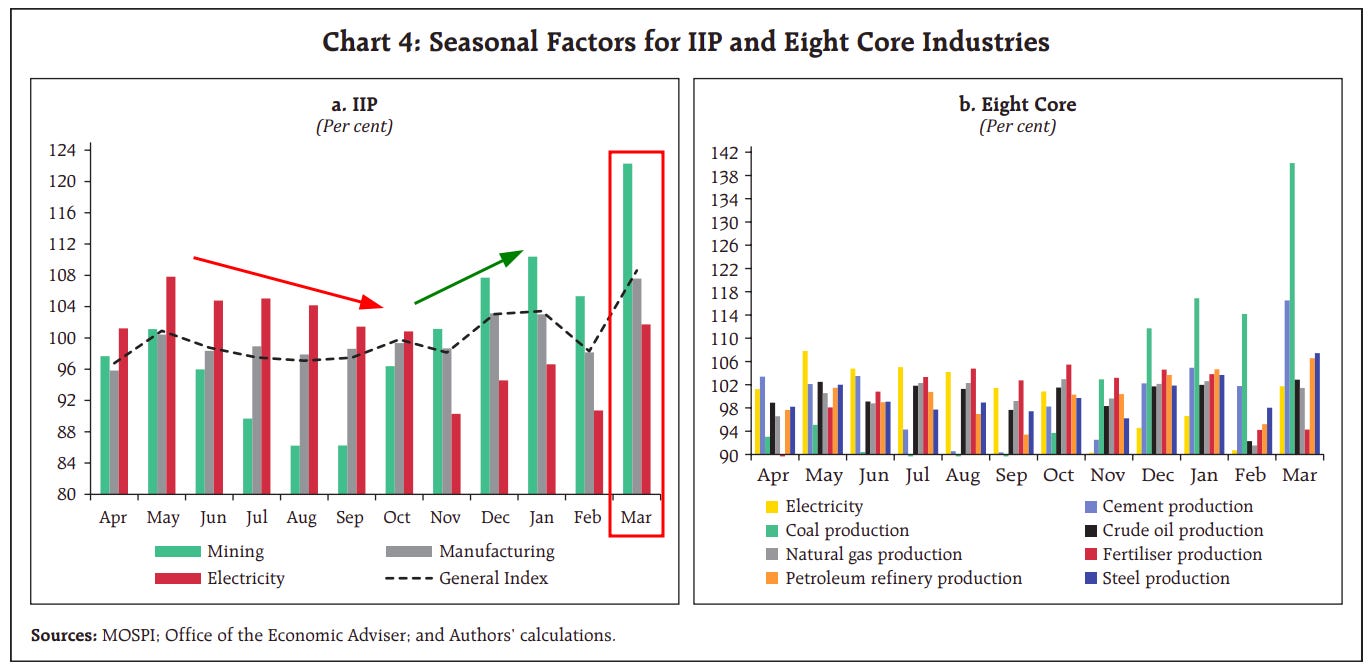
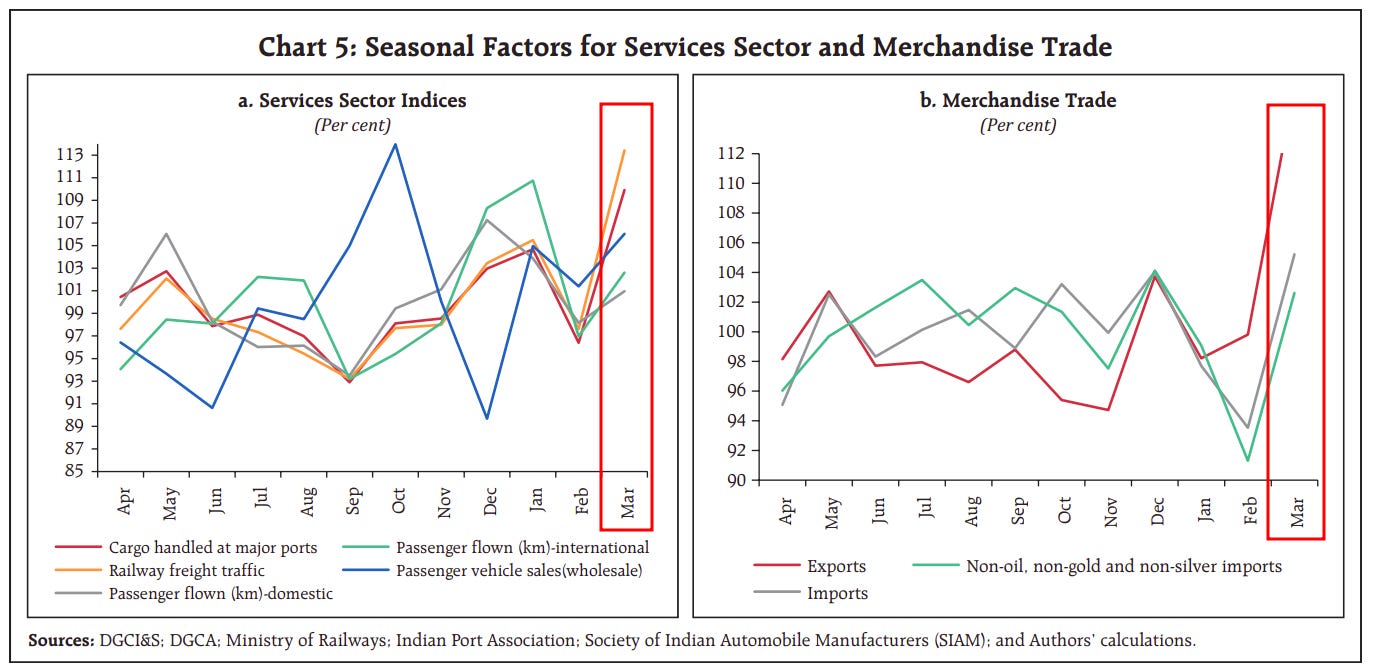
As more orders are fulfilled to round out the year, India’s exports and imports both swell in March.
All those goods are moved through our logistics network — using ships, rail, trucks etc. — all of which see a surge in activity toward the end of the financial year. Port cargo and railway freight, for instance, peak around March. Air travel, in contrast, moves differently, with its own mini-seasons and holiday spikes.
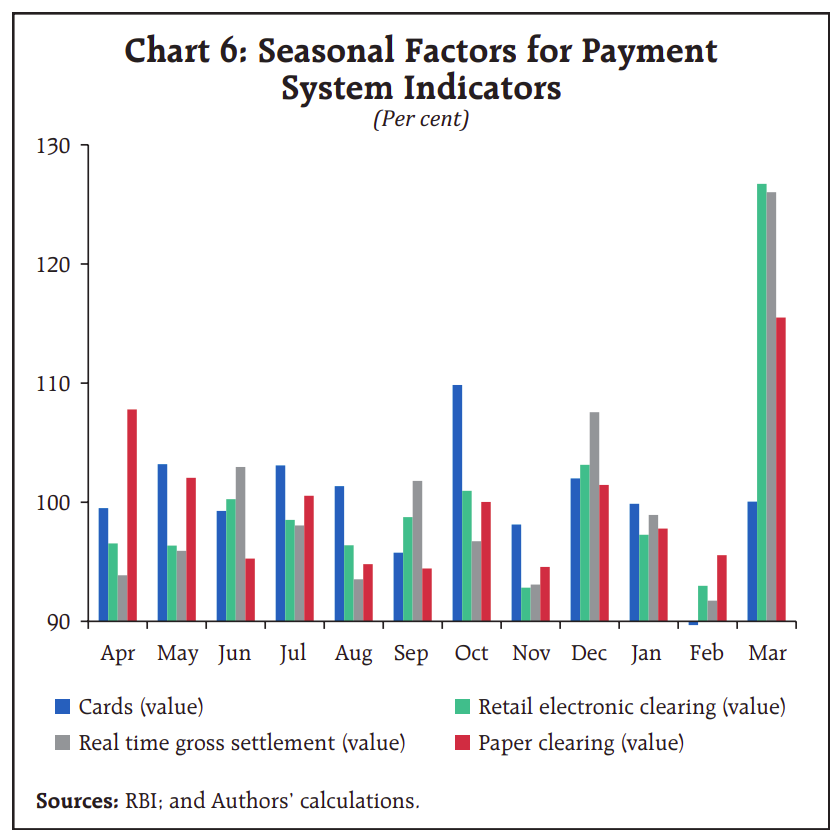
As economic activity flourishes, naturally, a lot of money changes hands. Meanwhile, companies settle dues and banks balance books, so that their year-end financials look clean. This shows up in the data. Real Time Gross Settlement (RTGS) transfers — large-value interbank payments — surge to record levels in March. Other channels, like cheque clearances and online transfers, also see a pronounced uptick.
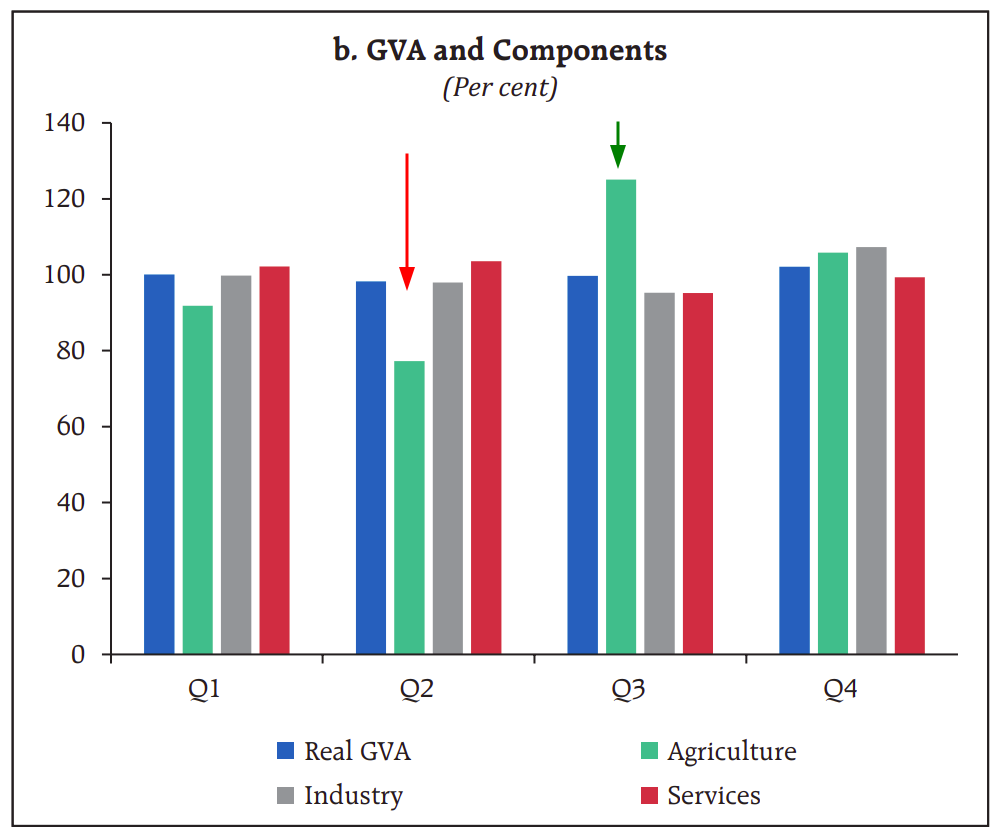
All of this explains why key macro numbers — like our GDP, or gross value added (GVA) — hit their highest levels in the March quarter each year. None of that signals runaway growth. These year-end spikes are simply part of the rhythm of Indian commerce.
Monsoon months and seasonal weather
As the year continues, India witnesses everything from scorching summers, to torrential rains. Not surprisingly, as the seasons change, so does our economy.
Between June to September, every year, the monsoon — the lifeblood of Indian agriculture — takes over the Indian economy. This is a source of major seasonal swings, changing everything from farm output to prices. This is most visible in food production and inflation, but the effects run much wider, showing up in sectors like mining and transport.
To begin with, each year, farmers sow the kharif crops, just as the monsoon arrives. Those rainy months are when these crops grow. Over those months, farms are preparing, not producing. India’s agricultural output, accordingly, is at its lowest in the July–September quarter. These crops are eventually harvested in autumn, around October, and agricultural production jumps sharply.
This is why the monsoon quarter consistently shows a seasonal slump in GDP, before output rebounds after the rains.
This swing is especially evident in food prices.
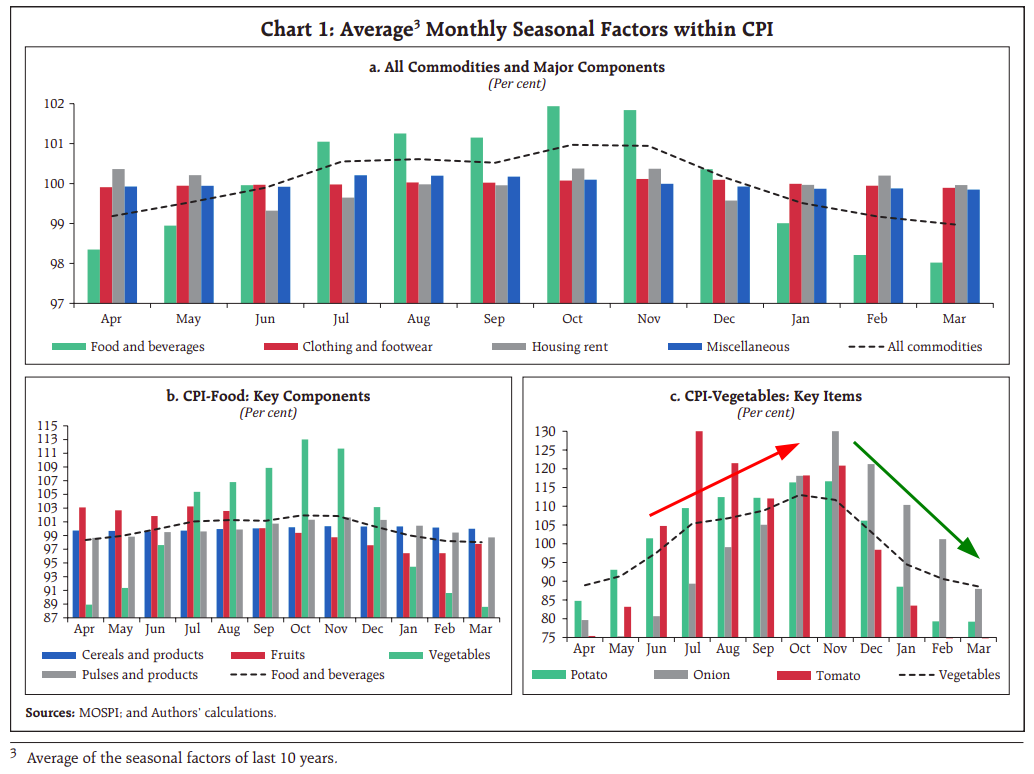
The supply of vegetables, in particular, is hostage to heavy rain. Vegetables are particularly sensitive to excess water — and bad flooding or waterlogging, in particular, can wipe out entire crops. The rains also make them harder to farm, and harder to transport. This is amplified by India’s poor storage infrastructure. And so, from July through October, vegetable prices spike. Staples like tomatoes, onions and potatoes become much costlier — sometimes dramatically so.
This shows up in inflation data. The overall consumer price index (CPI) usually hits a high every October, driven largely by monsoon-linked spikes in food prices. Fresh harvests then arrive by early winter, and supplies normalize, pulling prices down with them.
While industry and infrastructure see nothing this dramatic, they also feel the seasons impact them.
Mines, in particular, can get flooded during the monsoon. This is why mining output typically hits a low in September — the tail end of the rains — before rebounding as the ground dries. Similarly, construction projects slow down during heavy rain. This, in turn, means that building materials like cement or steel are in low demand.
The monsoon is also when power plants are coming out of their summer peak, when the entire country is cooling their homes and workplaces. Electricity generation peaks around May, the height of summer heat. It then moderates during the cooler, cloudier monsoon period.
As our economy winds down for the monsoon, logistics does so too. Railway cargo volumes usually bottom out around September, when industrial activity is weakest, before picking up once again after the rains are through. The rains are also when tourism and travel are off-peak. Domestic air passenger traffic, for instance, typically hits a yearly low around September.
All these weather-driven patterns are highly predictable. If any data you’re looking at shows a quarter-on-quarter slump, it’s worth asking if it was just a matter of bad weather.
Festivals and the autumn economic boost
Once autumn arrives, another force energizes India’s economy: the festive season. From late September through November, India sees major festivals like Durga Puja, Dussehra, Diwali, etc..
To finance geeks like us, these aren’t just cultural events, but an annual economic catalyst. Consumer sentiment turns upbeat. Households tend to make large purchases, considering this an auspicious time. Businesses launch festive-season sales. The result is yet another seasonal pattern in the data.
The clearest example of this comes in big-ticket purchases, like automobiles and appliances.
Many people, for instance, buy cars or two-wheelers in the Navratri–Diwali period, considering it an auspicious time. To close the deal, automakers too roll out discounts and new models. This creates a spike in the data: passenger vehicle sales consistently jump to a peak in October during the festive months. Often, it ends up being the top sales month of the year. By some estimates, festive periods account for 25-35% of annual sales for most companies.
Likewise, factories making consumer durables (fridges, TVs, etc.) ramp up output ahead of Diwali – as stores stock up every October for the festive rush.
But it’s not just big-ticket purchases. Retailers and online marketplaces of all sorts experience their hottest sales season during these weeks. As Diwali comes around, India goes on a massive shopping spree. People buy everything from new clothes, to sweets, to gadgets, to gold jewelry. The markets become crowded, while e-commerce platforms announce mega sales. This is also typically the holiday season — and services like travel and hospitality, too, see a bump in business.
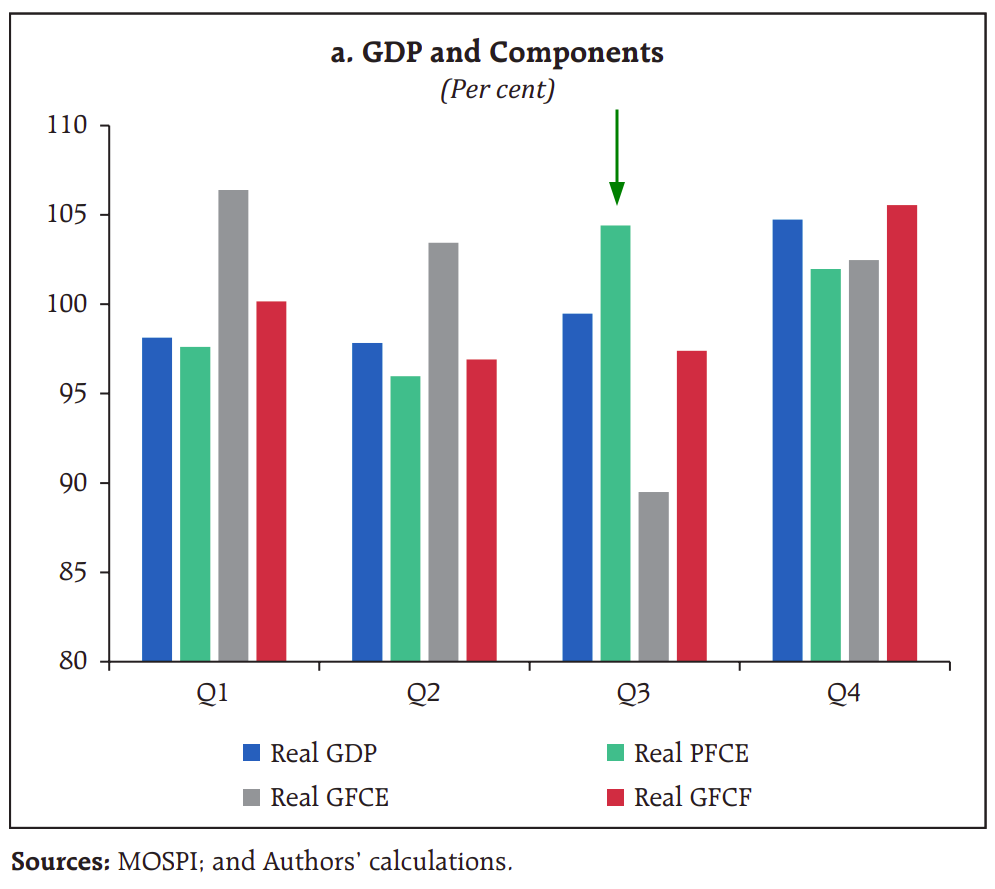
All of this shows up as a spike in consumption. Private consumption spending (PFCE) is routinely the highest in the October-December quarter, when all the major festivals arrive.
A lot of what is sold, at this time, comes from abroad. And so, in the weeks before the festive season, the external sector suddenly comes alive. Jewellers, for instance, start stocking on gold ahead of time, before Diwali and the wedding season come around. It’s common to see gold imports surge by September or October as jewelers “rush to build inventories”.
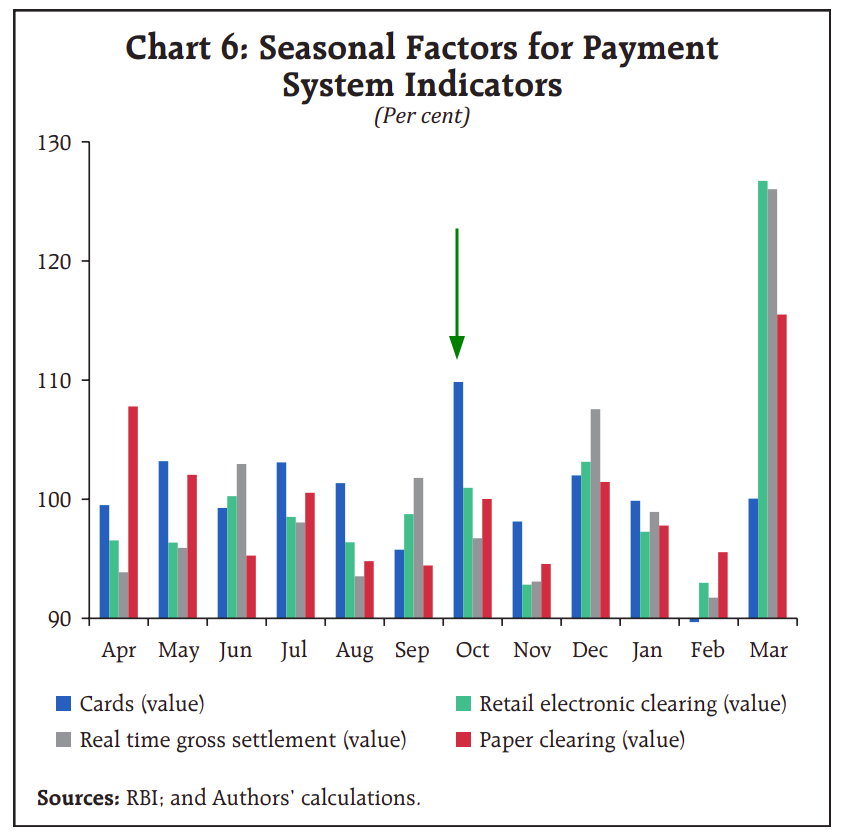
Festivals leave their mark on our payment systems as well. For instance, the Unified Payments Interface (UPI) — India’s hugely popular digital payments platform — often registers record transaction volumes in October, fueled by Diwali shopping sprees. Likewise, ATM withdrawals and card swipes jump as consumers spend their festive bonuses and gifts. While March is usually the annual peak for payment activity, the Diwali season reliably delivers another spike in both value and volume.
Because festival dates follow the lunar calendar, which shifts each year, the exact timing of this economic bump can vary. This year, for instance, some of the festive demand showed up in September itself, when the Navratri began. But broadly, the autumn quarter is always buoyant.
Once the festive season is over, you might see things quieten slightly. But this is simply the lull, once all that fervent activity has exhausted itself.
Conclusion: Reading the Seasonal Signals
If you’ve ever wondered why people in the financial world love year-on-year comparisons so much, this is why. India’s economic activity doesn’t stay steady through the year. As seasons change, so does commerce. These shifts are predictable, with each having its own rhythm. Year-end, monsoon, festive periods — each of these come with their own predictable swings.
If you want to understand financial data, recognizing these patterns is essential. If you see the numbers that look suspiciously strong or weak, it’s worth asking simple questions — like how heavy the rains were, or when Diwali arrived. This will tell you whether there’s a real signal, or just that time of the year.
Tidbits
India’s GDP target raised, but Trump tariffs flagged as risk
Fitch-owned BMI upgraded India’s FY26 GDP growth forecast to 6.5%, supported by stronger Q2 data, GST rate cuts, and rising vehicle registrations. But it warned that steep U.S. tariffs will start weighing on exports later this year, slowing momentum in FY27. AI investments and government spending are expected to cushion the impact.
Source: Economic Times
IMF may reclassify India’s FX framework
The IMF is likely to reclassify India’s foreign-exchange management regime, two years after it labelled it a “stabilized arrangement” instead of a floating system. The RBI disagrees with the tag, calling it incorrect and unjustified. The move comes as the rupee shows higher volatility under new RBI Governor Sanjay Malhotra.
Source: ReutersGST fast-track scheme sees surge in auto-approvals
India’s new Simplified GST Registration Scheme—launched Nov 1—triggered 142,000 automatic approvals in 15 days, with 66% cleared within 24 hours and the fastest processed in 21 minutes. Total registrations hit 217,000, sharply speeding up onboarding for small businesses, freelancers, and professionals.
Source:Business Standard
- This edition of the newsletter was written by Krishna and Kashish.
We’re now on Reddit!
We love engaging with the perspectives of readers like you. So we asked ourselves - why not make a proper free-for-all forum where people can engage with us and each other? And what’s a better, nerdier place to do that than Reddit?
So, do join us on the subreddit, chat all things markets and finance, tell us what you like about our content and where we can improve! Here’s the link — alternatively, you can search r/marketsbyzerodha on Reddit.
See you there!
Have you checked out Points and Figures?
Points and Figures is our new way of cutting through the noise of corporate slideshows. Instead of drowning in 50-page investor decks, we pull out the charts and data points that actually matter—and explain what they really signal about a company’s growth, margins, risks, or future bets.
Think of it as a visual extension of The Chatter. While The Chatter tracks what management says on earnings calls, Points and Figures digs into what companies are showing investors—and soon, even what they quietly bury in annual reports.
We go through every major investor presentation so you don’t have to, surfacing the sharpest takeaways that reveal not just the story a company wants to tell, but the reality behind it.
You can check it out here.
Introducing In The Money by Zerodha
This newsletter and YouTube channel aren’t about hot tips or chasing the next big trade. It’s about understanding the markets, what’s happening, why it’s happening, and how to sidestep the mistakes that derail most traders. Clear explanations, practical insights, and a simple goal: to help you navigate the markets smarter.
Subscribe to Aftermarket Report, a newsletter where we do a quick daily wrap-up of what happened in the markets—both in India and globally.
Thank you for reading. Do share this with your friends and make them as smart as you are 😉
Hi - Thanks again for two good stories.
I understand the second story is a just a summary of what RBI put out - and the charts used are taken directly from the report. But its difficult to figure out what most of the charts are showing - whether I am looking at mom/qoq or yoy numbers, or what do the %s mean - the seasonality should disappear if looking at yoy in most of the cases as majority of the trends mentioned have been playing out for multiple years now.
Loved the piece on amusement parks. I wonder if the reason is also the inability to scale beyond a point. Think about it: How many repeat customers can you really have in a business like this? I remember going to Wonderla early this year and that visit happened after almost 10 years. So, the next time I'll go will probably be after 10 years, and only if I have a strong reason to visit.