


Hello and welcome to Beyond the Charts! A newsletter where we dive into fascinating charts from the world of finance and the economy, breaking down what’s happening in a way that’s easy to understand.
Before we jump in, we have some news! Remember the name-suggestion contest from our last episode? Well, it’s time to reveal the winners. We promised a special gift for the person whose name we chose and for the funniest suggestion we received.
So, a big shoutout to Kshitij for coming up with the winning name, Beyond the Charts! And a huge thank you to Mitesh for making us laugh with the funniest entry.
If you prefer video format over reading, you can here.
Shining silver, but is it really?
Silver has been on a tear! Earlier this month, it crossed the ₹1,00,000 per kg mark, climbing over 30% this year and outshining both gold and the Nifty by a large margin. Now, comparing the Nifty to silver may seem like apples to oranges, but when something shines, people want it in their portfolios—making the comparison hard to ignore!

But how has silver performed as an investment?
While gold and silver share some similarities, they aren’t quite the same. Gold has long been valued for jewelry and investment, acting as a traditional store of value. In fact, central banks worldwide heavily rely on gold for their reserves, as we covered in the last edition.
Silver, though, is a “hybrid” metal. It's popular as an investment, but about 50% of its demand comes from industrial uses—electronics, semiconductors, solar panels, and more. In comparison, only around 5% of gold demand is industrial.
Silver often follows gold’s trends but with higher volatility, offering greater potential for gains. Because so much of silver’s demand is tied to industry, its price is also impacted by the overall economy. When the economy is strong, industrial demand for silver rises, potentially pushing prices even higher.

Coming to how silver has performed as an investment—silver’s performance hasn’t been all that impressive. Since 1999, silver has significantly lagged behind both the Nifty and gold in returns.
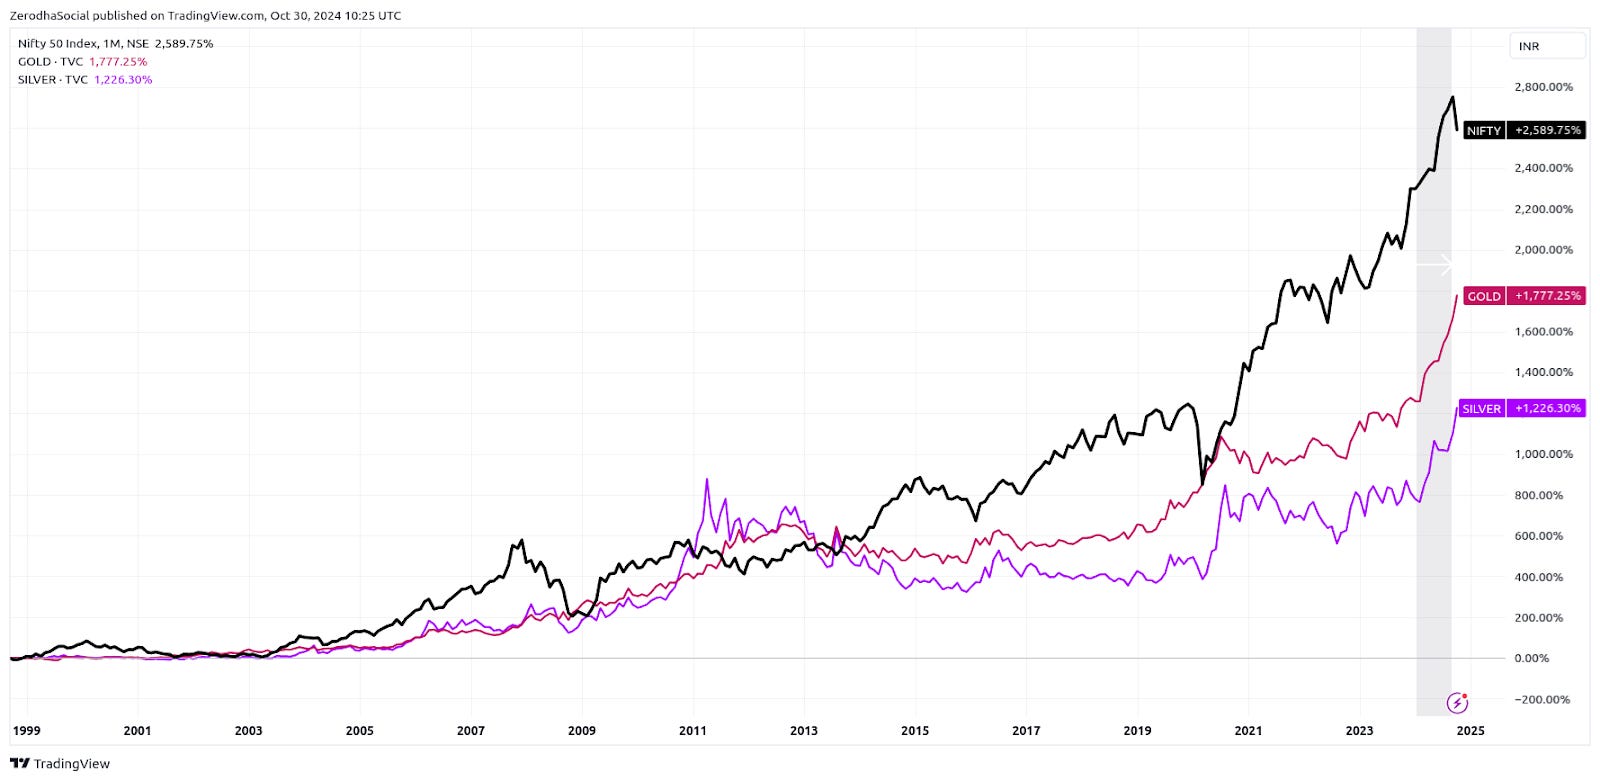
In fact, over the last 25 years, Silver has outperformed Nifty and Gold only on 6 occasions.

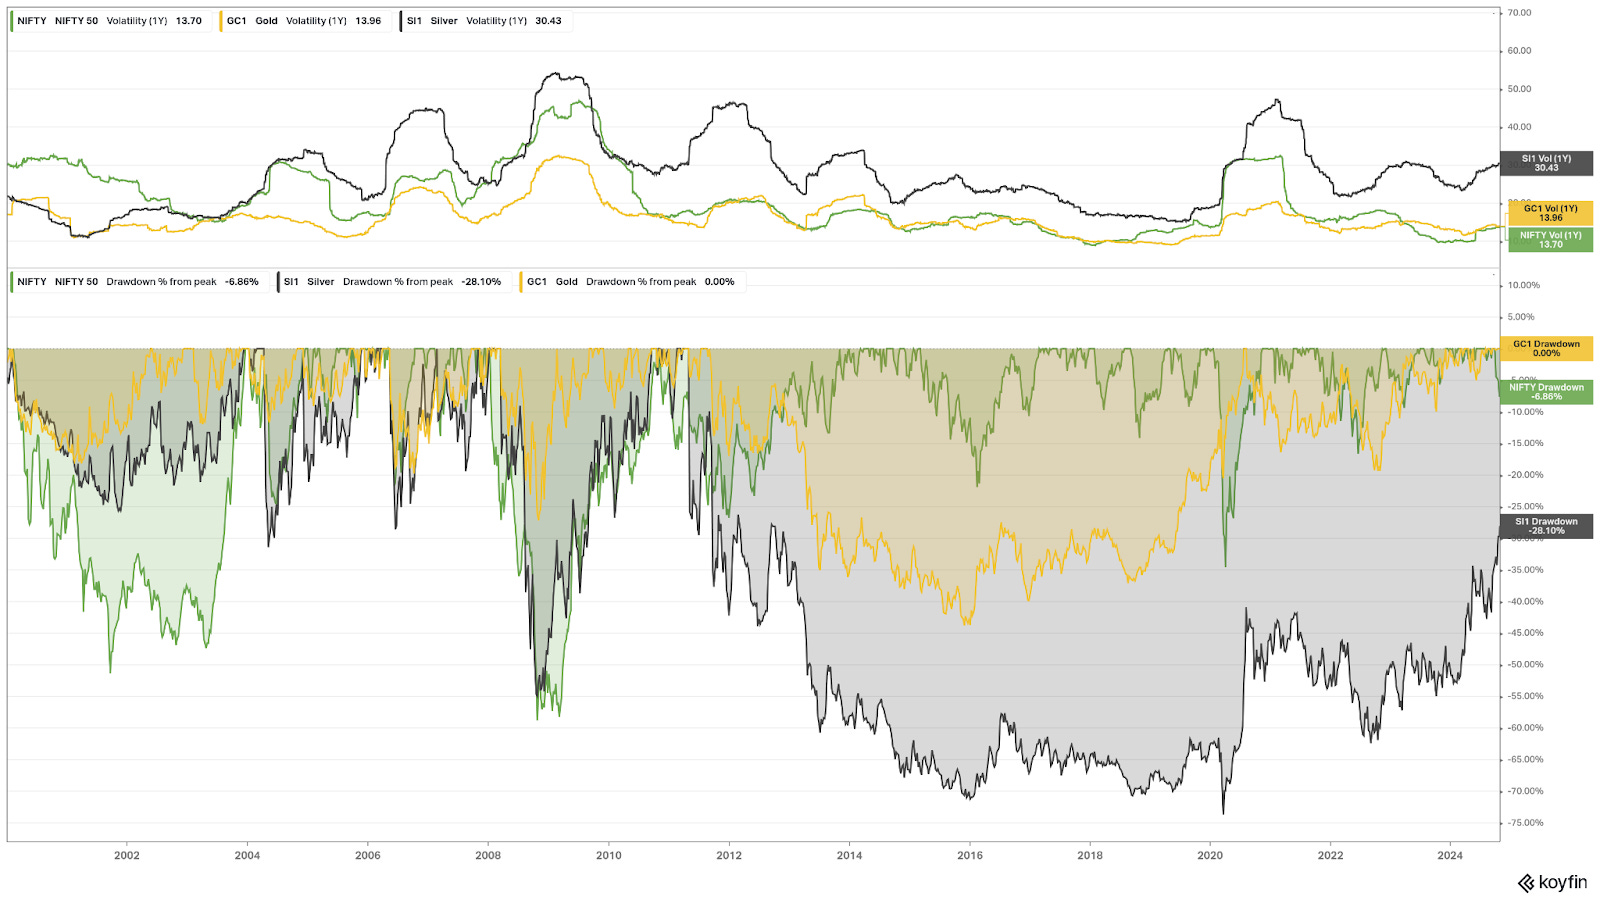
While silver can have brief moments of dramatic price spikes, these are often followed by long stretches of poor performance. Although gold shows similar patterns, silver tends to be much more volatile. When prices drop, silver usually falls harder than gold, experiencing deeper declines—what investors call “drawdowns”—as shown in the chart.
Importance of diversification
Given that we are talking about assets and their performance, it also makes sense to take a look at the performance of diversified portfolios. This is particularly relevant now, as large, mid and smallcap stocks are down between 5-6% in October, and investors are freaking out.
When investing in markets, it's not wise to put all your eggs in the same basket because if that basket falls, you have no eggs left. While everyone wants the highest returns by investing 100% in equities, that's not the right way to invest. When things are good, you will get good returns, but when things are bad, you will hurt badly. For example, Nifty 50 was down about 58% in 2008.

Diversifying your investments across various assets—such as equities, gold, bonds, and international markets—is a proven strategy to reduce risk and protect your money from market fluctuations. This approach allows you to benefit from market gains while providing a cushion during downturns.
Take silver, for example. It's highly volatile and can experience prolonged periods of poor performance. Relying solely on such an asset for your savings would be risky. Diversification helps mitigate this risk by spreading investments across different asset classes that don't all move in the same direction simultaneously, increasing the likelihood of building lasting wealth over time.
DSP Mutual Fund recently highlighted this in their newsletter, showcasing a chart that compares 20-year annual returns across various asset classes against a multi-asset portfolio. This illustration underscores the benefits of diversification in achieving more stable and consistent returns.

This chart shows how equity, debt, and gold have performed year by year, highlighting the advantage of a diversified portfolio. Diversification not only provides upside potential but also limits losses during market downturns. While it may slightly reduce overall returns, it significantly lowers risk, making it a valuable trade-off to consider in a balanced investment strategy.

An important note of caution
People often look at historical charts and assume they can time the market based on past patterns. In reality, this is much harder than it seems. Just because an asset performed well one year doesn’t mean it will repeat the same pattern the next. Past performance isn’t a guarantee of future results.

Another perspective on performance
We ranked the yearly performance of equity, debt, and gold, and the best-performing asset class changes often. This unpredictability is why spreading investments across all of them is the smartest approach. Diversification lets you benefit from different assets’ strengths without betting everything on one.

Every asset class goes through periods of underperformance. For instance, equities led returns from 2006 to 2008 but delivered no gains from 2008 to 2013. Similarly, gold dominated from 2008 to 2013 but turned negative from 2013 to 2018. As investors, we can’t predict which asset will outperform or how long these cycles will last, making diversification essential for balancing returns over time.

Each asset class has unique returns and risk levels, so your asset allocation has a big impact on both your portfolio’s returns and its volatility, as shown in this chart. A 100% debt portfolio has the lowest returns and volatility, while a fully equity portfolio offers the highest returns but also the highest risk. Shifting from debt toward equities or gold changes the balance between returns and volatility significantly.
Your goal as an investor should be to find an asset mix—between equity, debt, and gold—that you can comfortably hold for the long term. There’s no one-size-fits-all portfolio. The best choice depends on your life circumstances, age, risk tolerance, and financial capacity. Often, the best portfolio is the one that lets you sleep soundly at night.

How does India invest
Speaking of diversification, the conventional wisdom long held that Indians were risk-averse investors who put most of their money in real estate, gold, and fixed deposits. While this still holds true, there’s been a noticeable shift over the past decade.
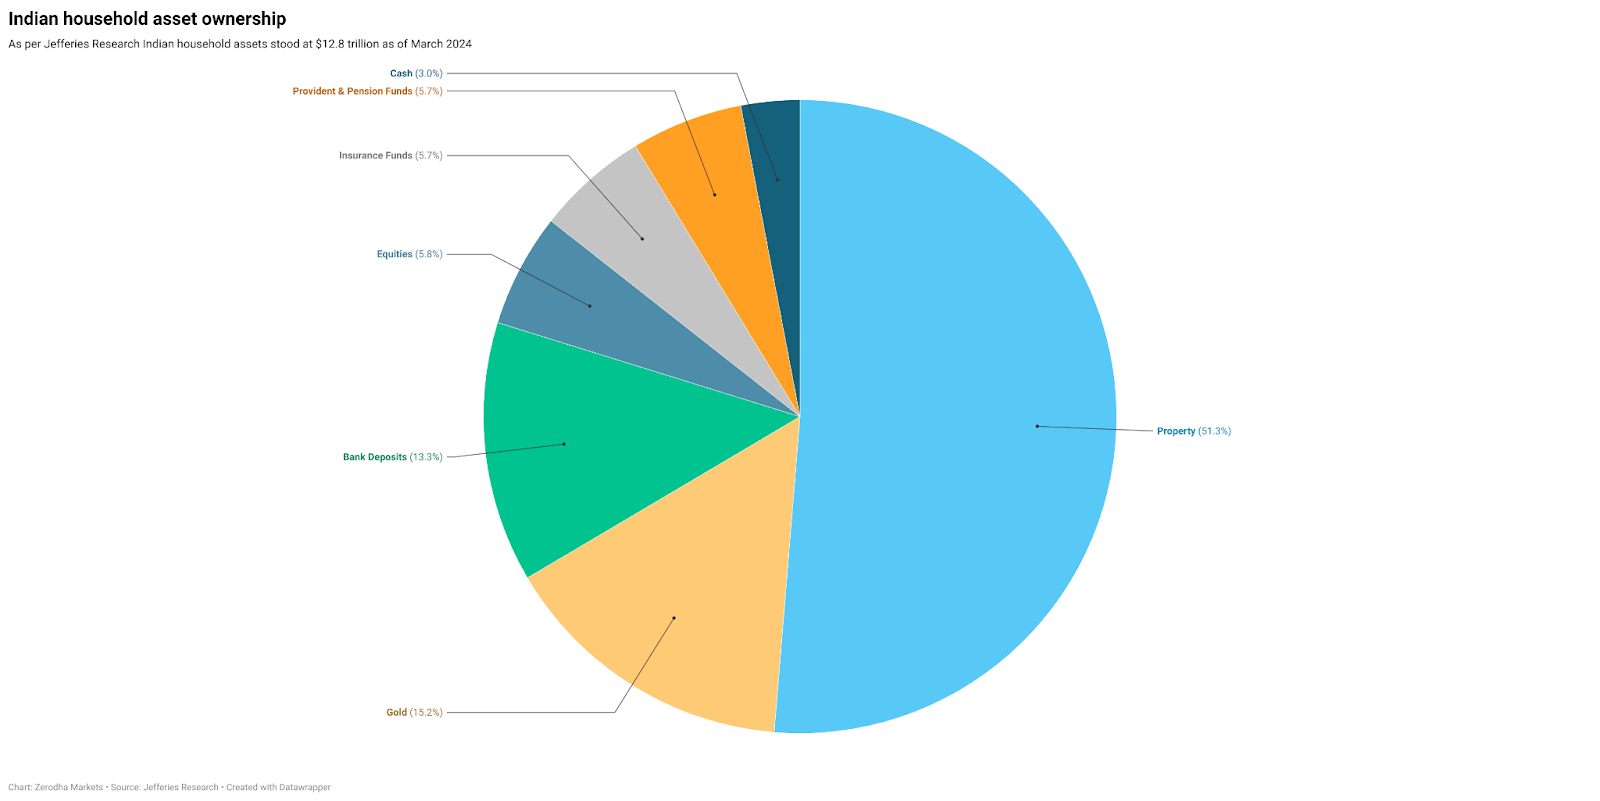
According to a Jefferies report, of India's $12.8 trillion in household savings, 51% is invested in property, followed by 15% in gold. In contrast, equities make up just 5.8% of total investments. This change hints at a gradual move toward more diversified portfolios, even if equities remain a smaller portion of overall investments.
But if we remove property and gold, it's exciting to see the steady rise in Indians investing in stocks and mutual funds, especially with the boost since the pandemic. Motilal Oswal recently shared some interesting stats: Indian households now own 22% of all listed stocks, up from 15% in 2013—and that’s not even counting mutual fund investments.

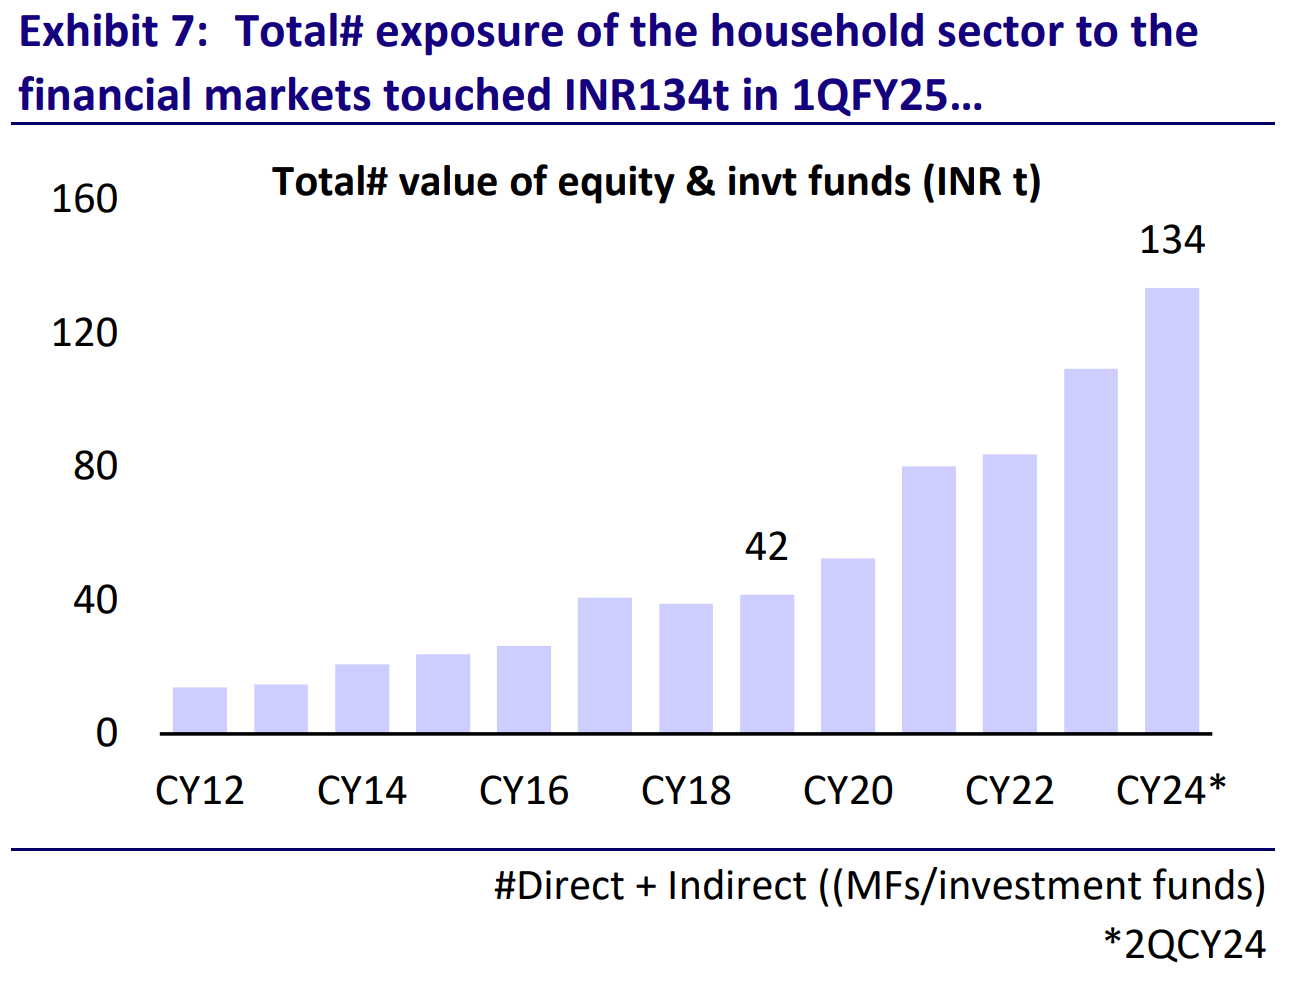
Combining direct and indirect exposure through stocks and mutual funds, Indian households now hold investments worth ₹134 lakh crore (around $1.6 trillion). This is about 44% of India’s GDP. In contrast, households in most advanced economies (except the US and Canada) invest between 30% and 55% of GDP, while in the US and Canada, household investments exceed 100% of GDP.
Compared to other markets, Indian households hold 21.5% of the stock market, second only to the US, where the share stands at 39.6%.

The share of mutual funds, NPS, and other investments in household savings has risen from 17% in 2019 to 28% in 2024, showing how mutual funds have helped millions of Indians start their investment journeys. In fact, households—including both retail investors and high-net-worth individuals—now own about 63% of the mutual fund industry’s AUM in 2024, up from 55% in December 2019.

Food is still very hot
India’s Consumer Price Inflation (CPI) is on the rise again. If you’re not familiar, CPI measures inflation by tracking the average price changes of a basket of goods and services over time. In simple terms, it tells us how much more expensive everyday essentials have become for the average household.
After easing to around 3.6% in July and August, inflation jumped to a 9-month high of ~5.5% in September. The drop in July and August was mainly due to what’s called a “favorable base effect.” This happens when current inflation looks lower compared to the same time last year because prices back then were already quite high. But now that this base effect has faded, inflation is creeping up again.
The key reason behind the September spike? A surge in food prices.

Food items make up nearly 46% of the CPI basket, so when food prices rise, CPI inflation often follows. In September, food inflation surged to about 8.4%, largely due to higher prices for vegetables, pulses, and fruits.

The prices of vegetables, pulses, and fruits have stayed high due to unfavorable weather conditions—like heatwaves, unseasonal rains, and uneven monsoon rainfall. For instance, in September, vegetable prices surged by 36%, compared to around 11% in August.

The hope is that favorable monsoons will help cool down food inflation, which would ease overall CPI inflation. However, the RBI has made it clear in its recent policy meeting that it won’t consider cutting interest rates until inflation is under control and closer to its 4% target. This cautious stance remains despite the recent 0.5% rate cut by the U.S.

Outward remittances on the rise again
Outward remittances—funds sent out of India under the Liberalised Remittance Scheme (LRS)—have been gradually picking up over the past few months. After peaking at around $3.8 billion (roughly Rs 32,000 crores), they dropped to about $1.8 billion (around Rs 15,000 crores) in November last year.
The LRS allows resident individuals to send up to $250,000 (approximately Rs 2 crores) abroad for specific purposes like travel, investments, medical treatment, studies, and more.

Foreign travel makes up the largest chunk of remittances. In August, out of the $3.8 billion in total remittances, about $2 billion (around Rs 16,800 crores) was transferred specifically for travel purposes.

Interestingly, more Indians are now sending money abroad to invest in things like US stocks, ETFs, and other global assets. One key reason for this surge is that the RBI has set a $7 billion (around ₹58,800 crores) cap on overseas investments by Indian mutual funds—and the industry has already hit that limit. As a result, many international mutual funds have stopped accepting new investments. This has led some Indians to open online investing accounts to directly invest in international stocks, ETFs, and more.

That’s it from us. Do let us know your feedback in the comments—the things you liked, the things you didn’t, and what you want us to improve on. And do share this with your friends to spread the word.