
Rising government interest costs, China’s solar pain, Trillion dollar chip race and more | Beyond the Charts

Hello and welcome to Beyond The Charts. A series where we look at charts to make sense of what’s happening in finance and the economy and uncover the stories they tell.
Rising cost of government debt
Remember when interest rates were close to zero? Back then, governments could borrow cheaply. They racked up record amounts of debt to pay for everything from pandemic relief to new infrastructure. But that era is over, and the bill is coming due.
A Goldman Sachs report shows just how serious this has become. Even though central banks have started cutting rates from their highs, the interest burden on major economies is still rising.
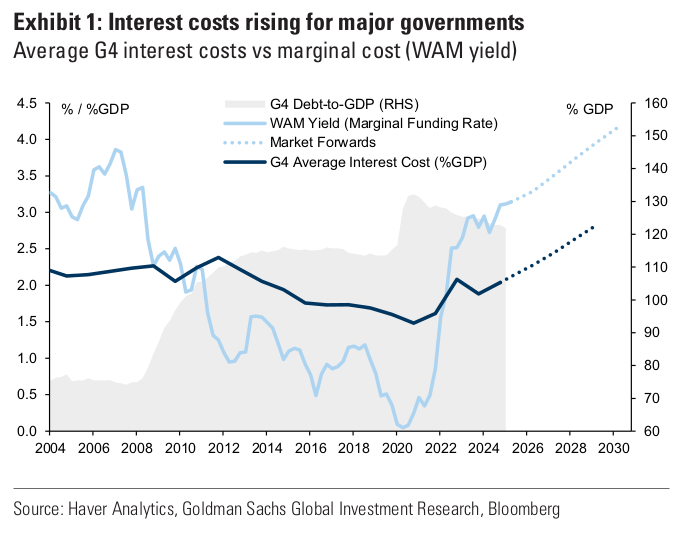
Here’s what’s happening. Old, cheap debt is coming due and being refinanced at much higher rates. It’s like a homeowner whose 2% mortgage expires and suddenly has to refinance at 6%. The debt itself hasn’t grown, but the payments have shot up.
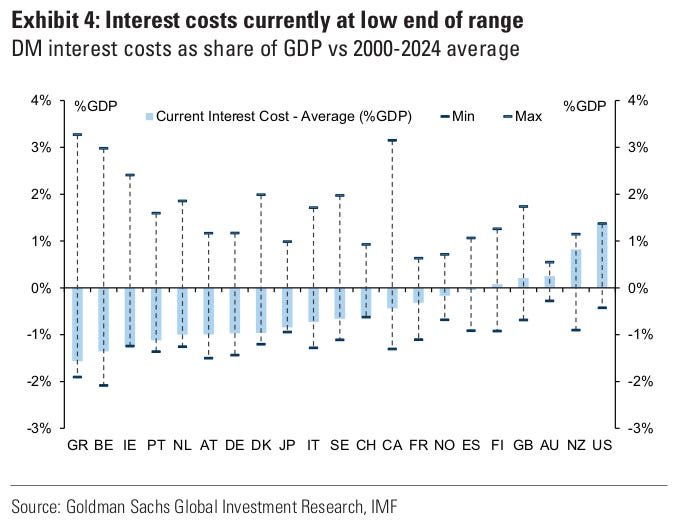
For now, governments are still cushioned by the ultra-low rates of the past decade, which keep interest costs at the lower end of historical ranges.
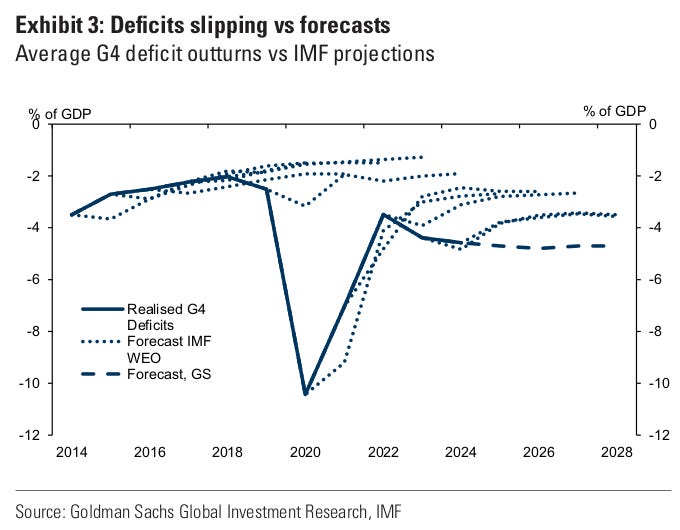
But that cushion is fading as older bonds mature and are refinanced at higher rates. Since the pandemic, budget deficits in the US, UK, and Europe have regularly ended up larger than initial projections.
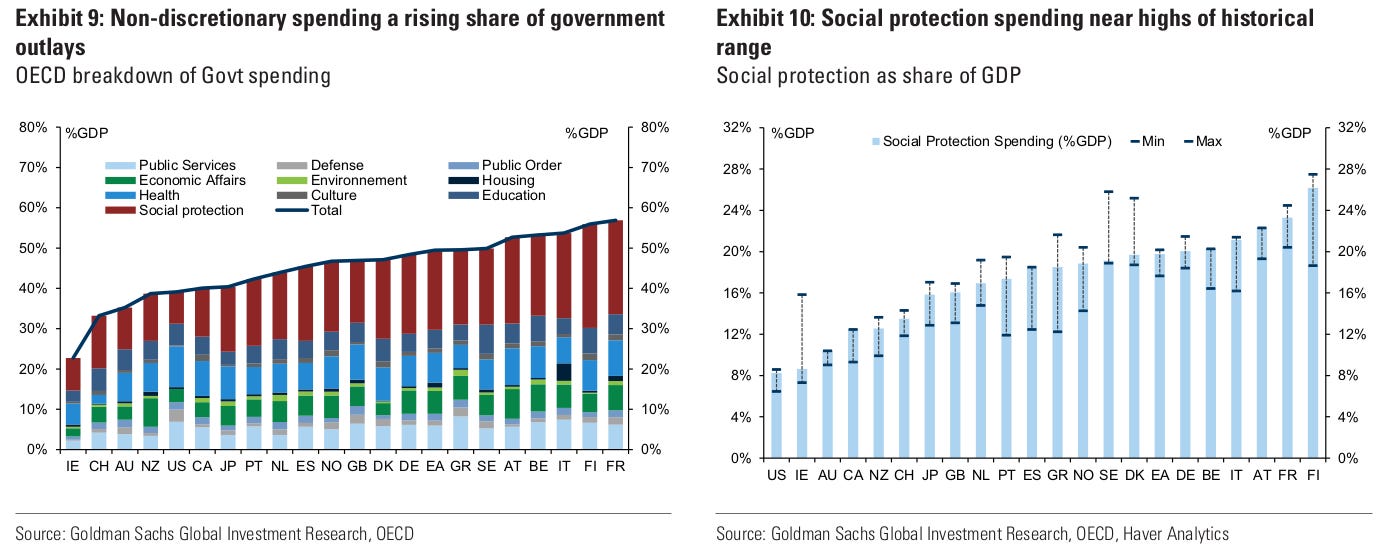
This isn’t just a bookkeeping problem. Rising interest costs are mandatory; governments have no choice but to pay them. That leaves less room in the budget for areas like healthcare, education, infrastructure, and climate programs.
The Goldman Sachs report points out that spending on social protection and healthcare is already near the top of historical ranges, which makes cutting back politically difficult. At the same time, defense budgets are also climbing across much of Europe.
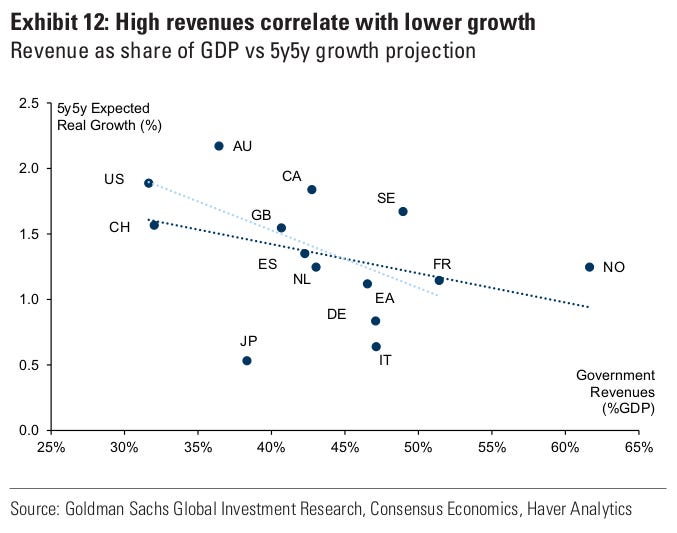
To bring budgets under control, governments face a tough choice: raise taxes or cut public services. But higher taxes aren’t a simple fix either. In much of Europe, revenues are already above their historical average as a share of GDP. And Goldman notes that higher tax-to-GDP ratios often go hand in hand with slower growth.
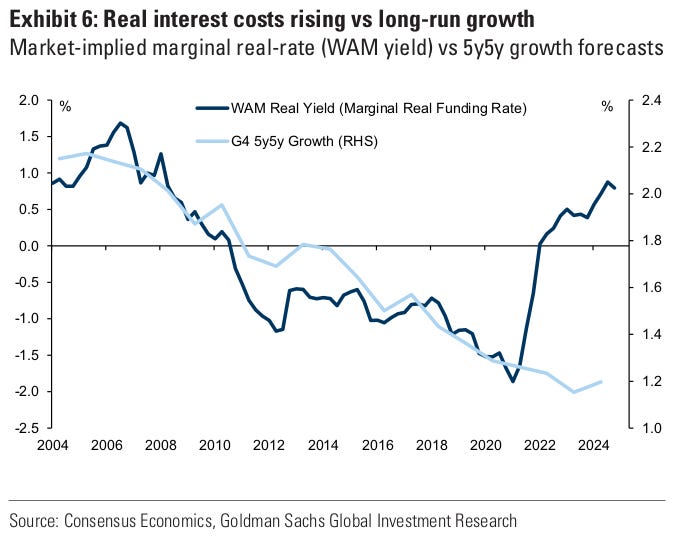
Another big question is whether real interest rates rise faster than real growth. If the cost of borrowing ends up higher than the growth rate, managing debt becomes much harder.
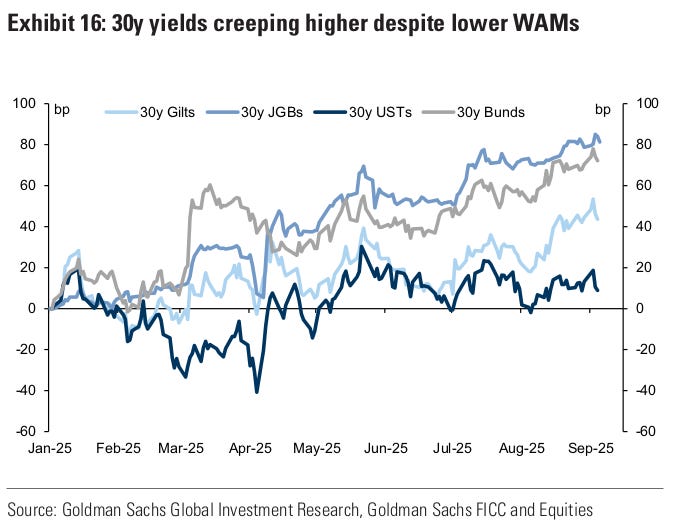
Long-term bond yields have already climbed, reflecting these fiscal pressures. In fact, 30-year bonds in the US, UK, and Europe are now at their highest levels in decades.
China’s solar pain
China dominates the global solar industry, controlling close to 90% of the world’s manufacturing capacity for solar cells. This has helped drive solar panel prices to record lows, speeding up the global energy transition.
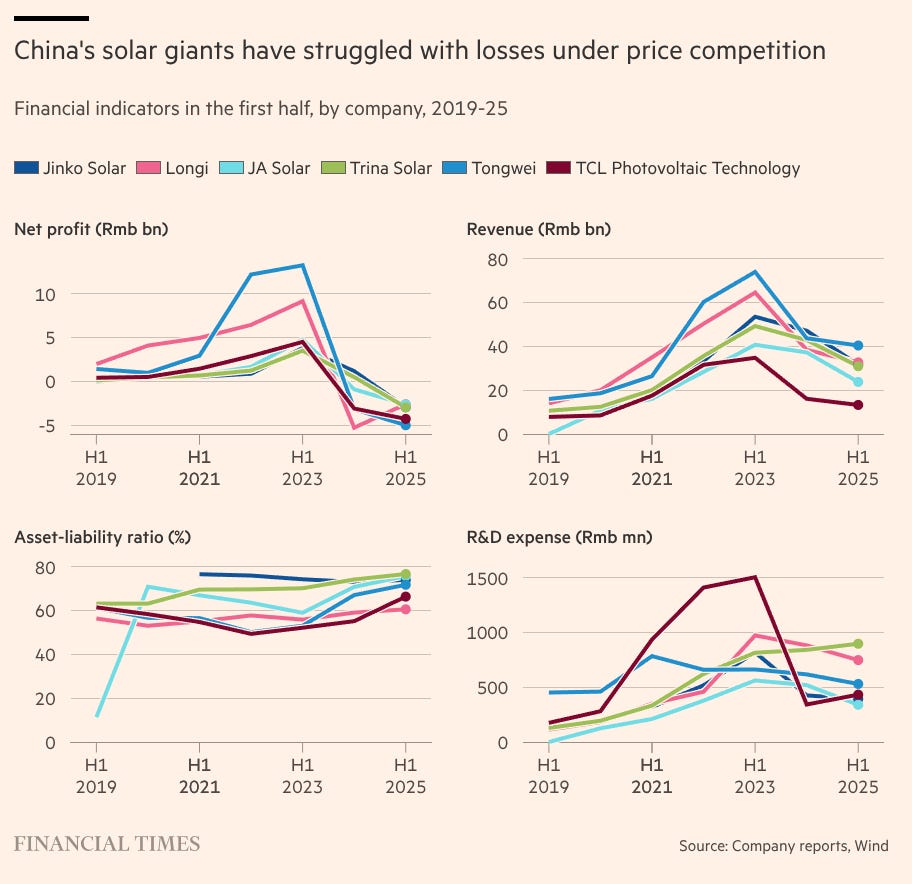
But a recent Financial Times article shows the industry is now facing a severe crisis. In the first half of 2025 alone, six of China’s biggest solar companies lost a combined RMB 20.2 billion, or about $2.8 billion, more than double their losses from a year earlier.
Driven by Beijing’s push for technological leadership, Chinese companies rapidly expanded capacity, adding new factories and production lines at an unprecedented pace. In 2024 alone, China produced 588 gigawatts of solar cells, far more than the combined demand at home, about 277 gigawatts, and abroad, about 174 gigawatts.
The result is what economists call ‘involution,’ that is, intense internal competition where everyone produces more, but no one actually gains.
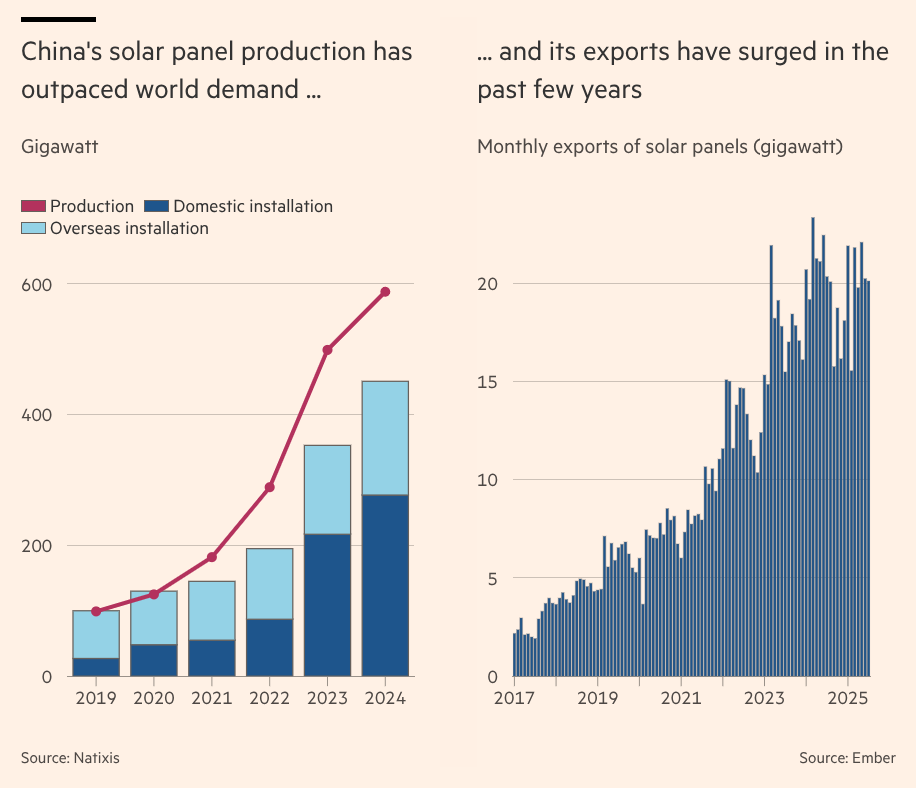
To clear excess inventory, Chinese companies are now selling solar panels at prices below cost, hoping to outlast their rivals. Since 2021, solar module prices have nearly halved. For consumers worldwide, that means record-low installation costs. But for producers, it has been devastating—margins have disappeared, and balance sheets are under heavy strain. What was once one of China’s most profitable green-tech sectors is now loss-making.
The upside for the rest of the world is cheaper solar, which helps speed up the green transition. The downside is that this wave of cheap, state-supported exports is hurting solar manufacturers in the US, Europe, and India and could spark trade disputes.
The trillion-dollar chip race
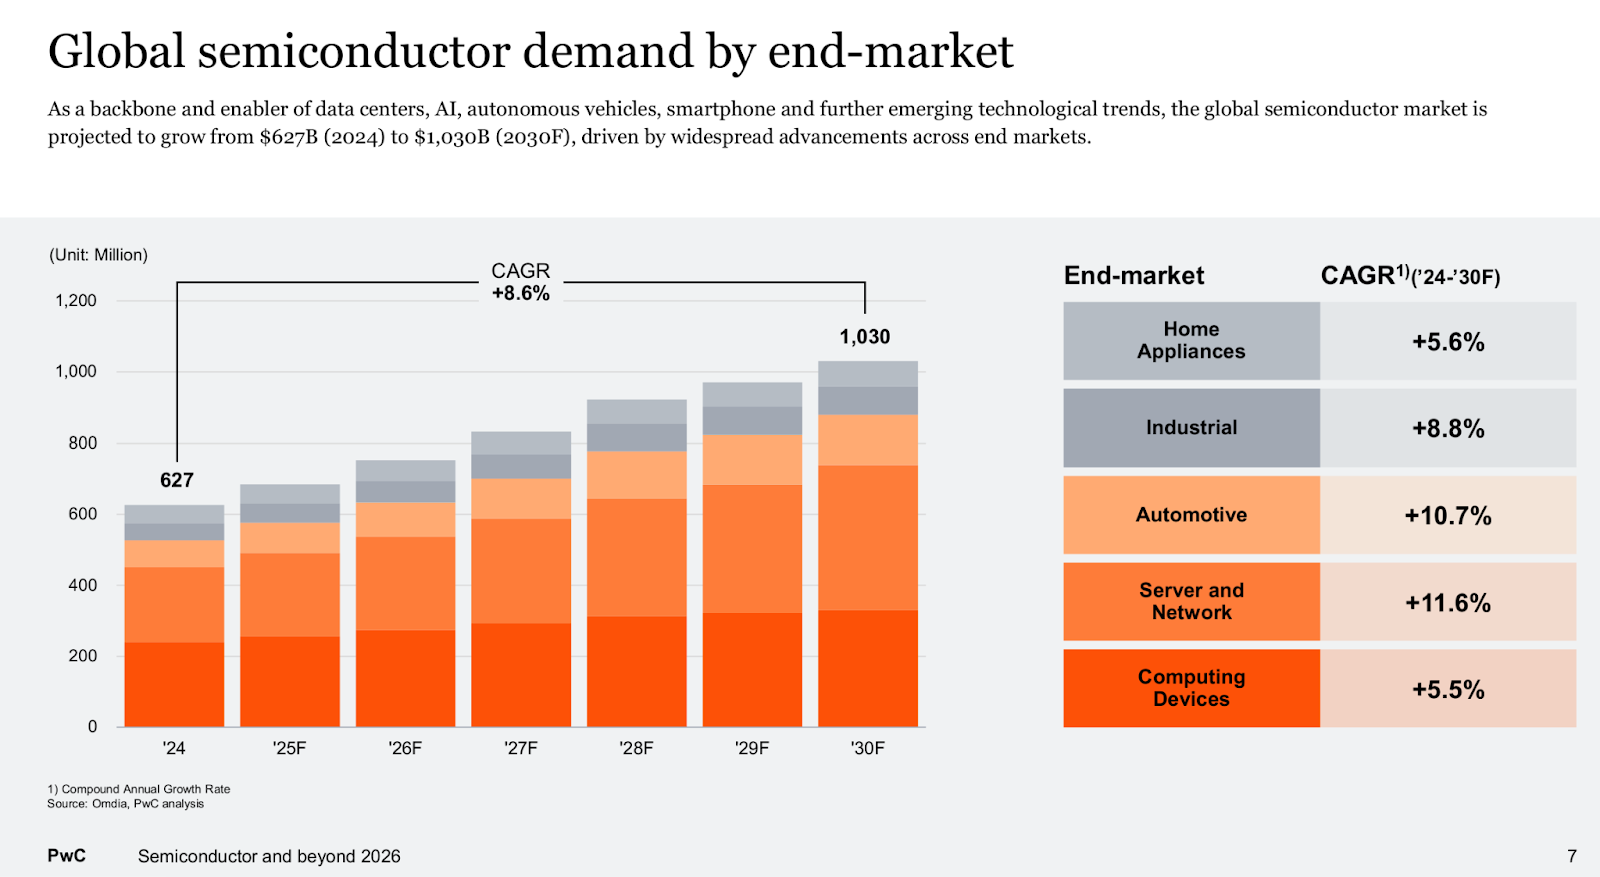
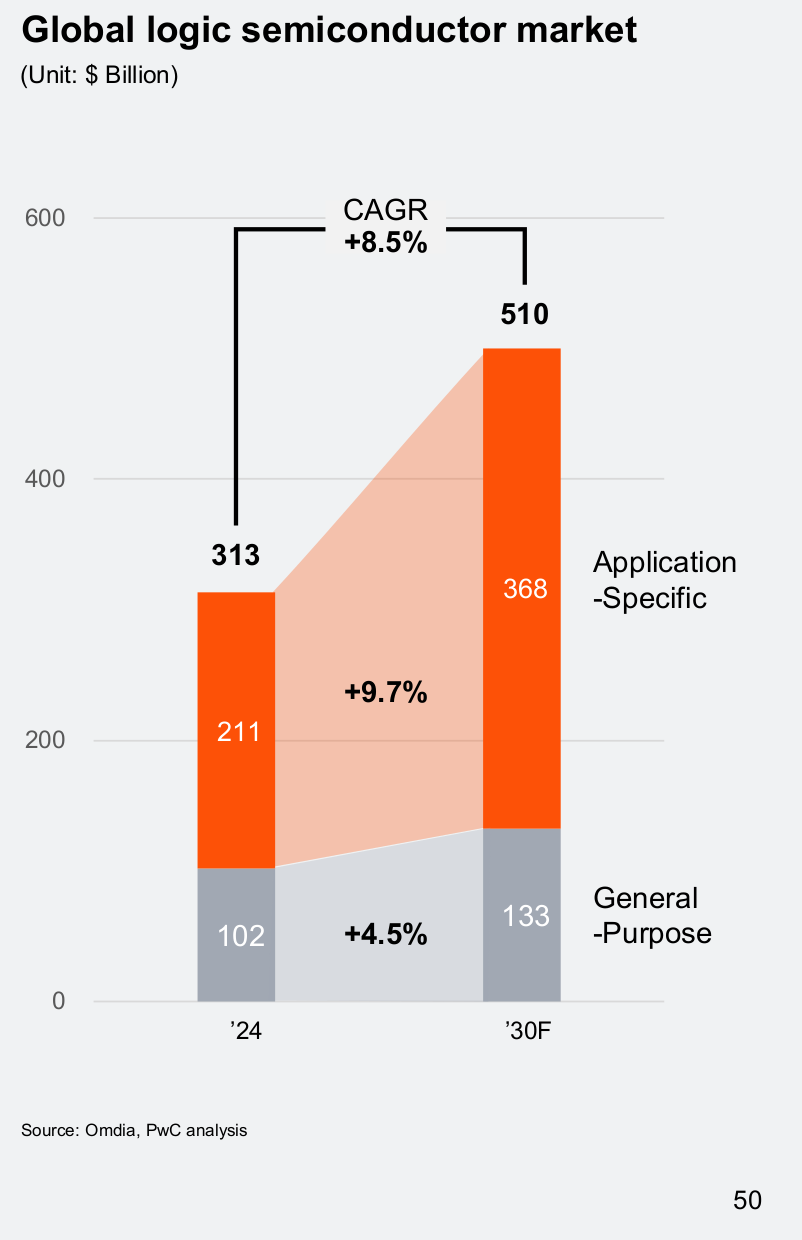
By 2030, the global semiconductor market is projected to cross $1 trillion, up from about $600 billion today. A new PwC report says this surge is being driven by two forces: the rise of Artificial Intelligence and the transformation of cars into software-driven machines.
Semiconductors are no longer just about powering PCs and smartphones. Those remain huge markets, but the fastest growth is coming from new areas that need more specialized and powerful chips.
Services like ChatGPT have kicked off an arms race for computing power. PwC projects that chips for servers and networks—the backbone of data centers and AI training—will grow the fastest, expanding at about 11.6% a year through 2030. By then, data center chips alone will account for more than half of the industry’s revenue.
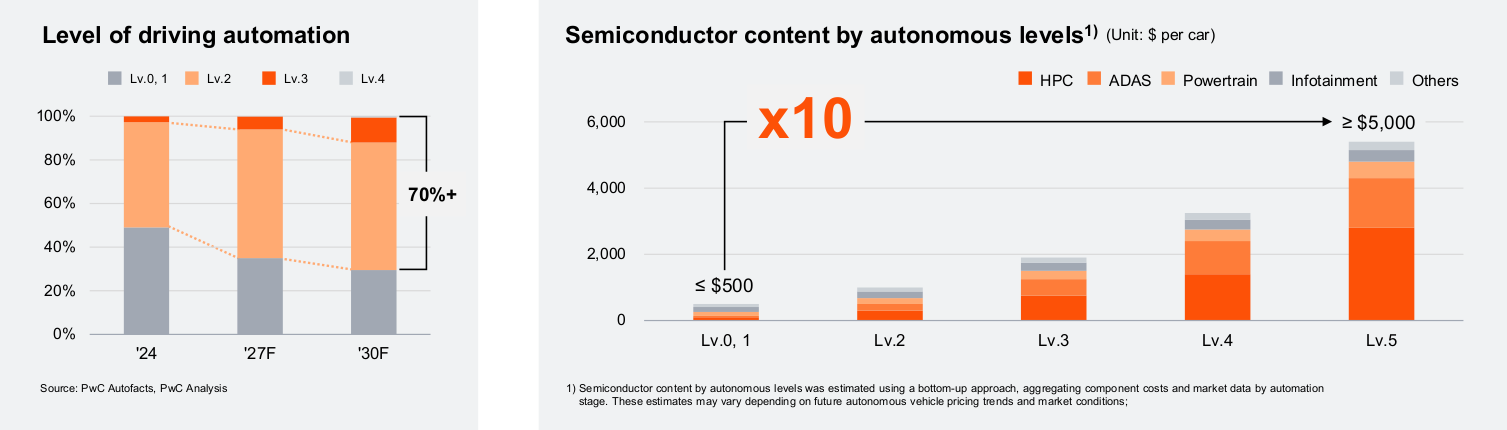
The second big growth driver is autos. With electric vehicles, autonomous driving, and software-defined cars, vehicles now use more chips than ever before. To put that in perspective, a basic Level 0 or Level 1 car—meaning no or minimal self-driving features has less than $500 worth of semiconductors. But a fully autonomous Level 5 car, capable of driving itself in all conditions, could pack in more than $5,000 worth.
That tenfold increase comes from the need for high-performance computing, advanced sensors like cameras, radar, and LiDAR, and always-on connectivity. Automotive chips are projected to grow at about 10.7% a year, making it the second-fastest-growing segment after servers.
But this isn’t just about technology—it’s also about geopolitics. The race for semiconductor leadership is reshaping global supply chains and national policies. Chips have become central to the contest for technological supremacy. Worried about supply disruptions, governments are now pouring hundreds of billions into local manufacturing and research.
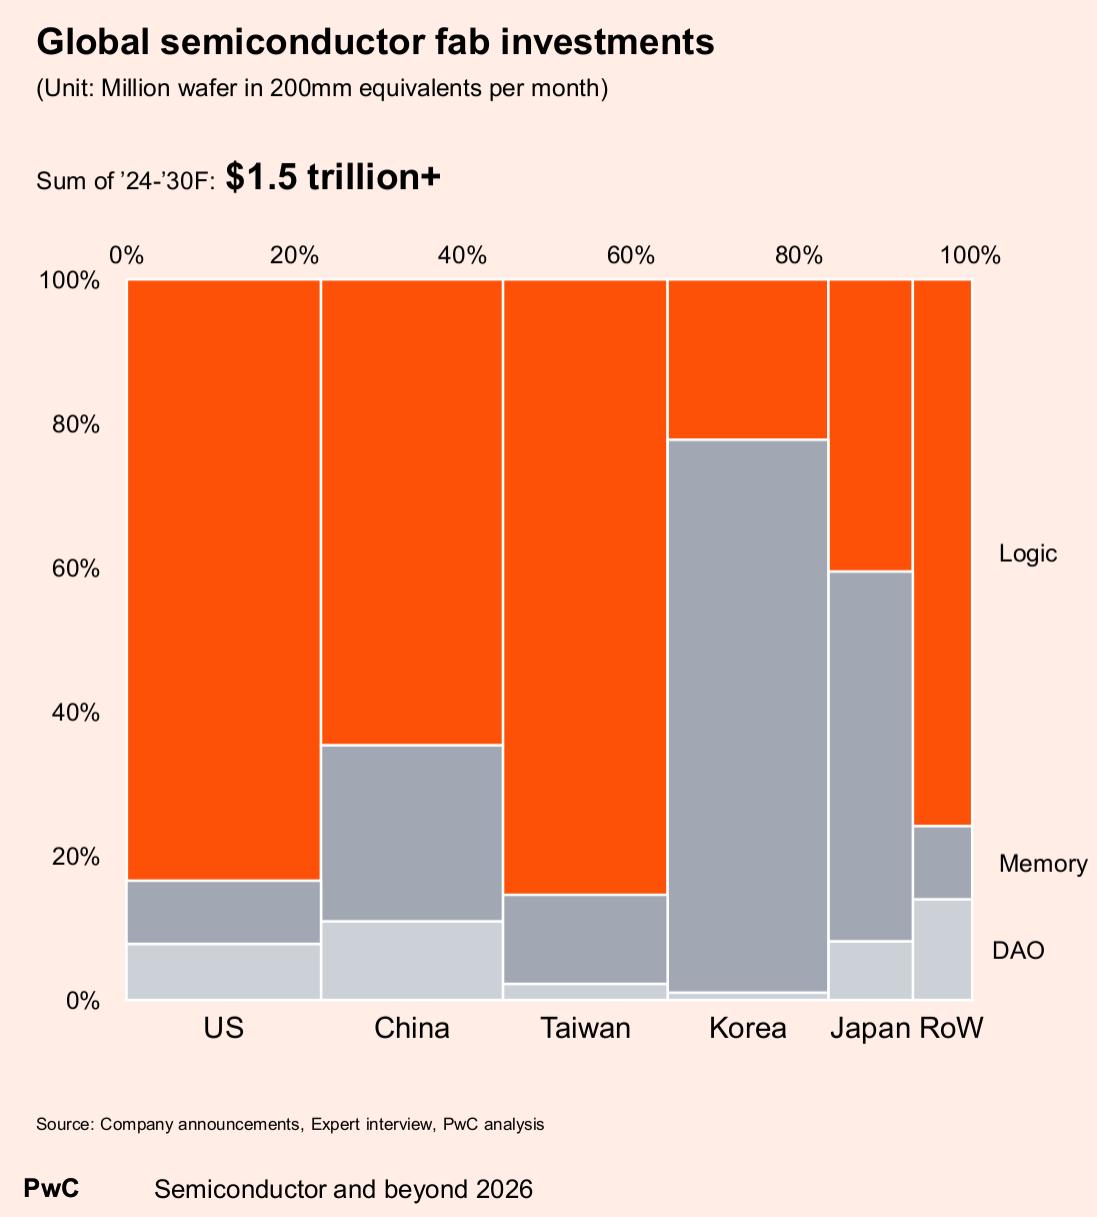
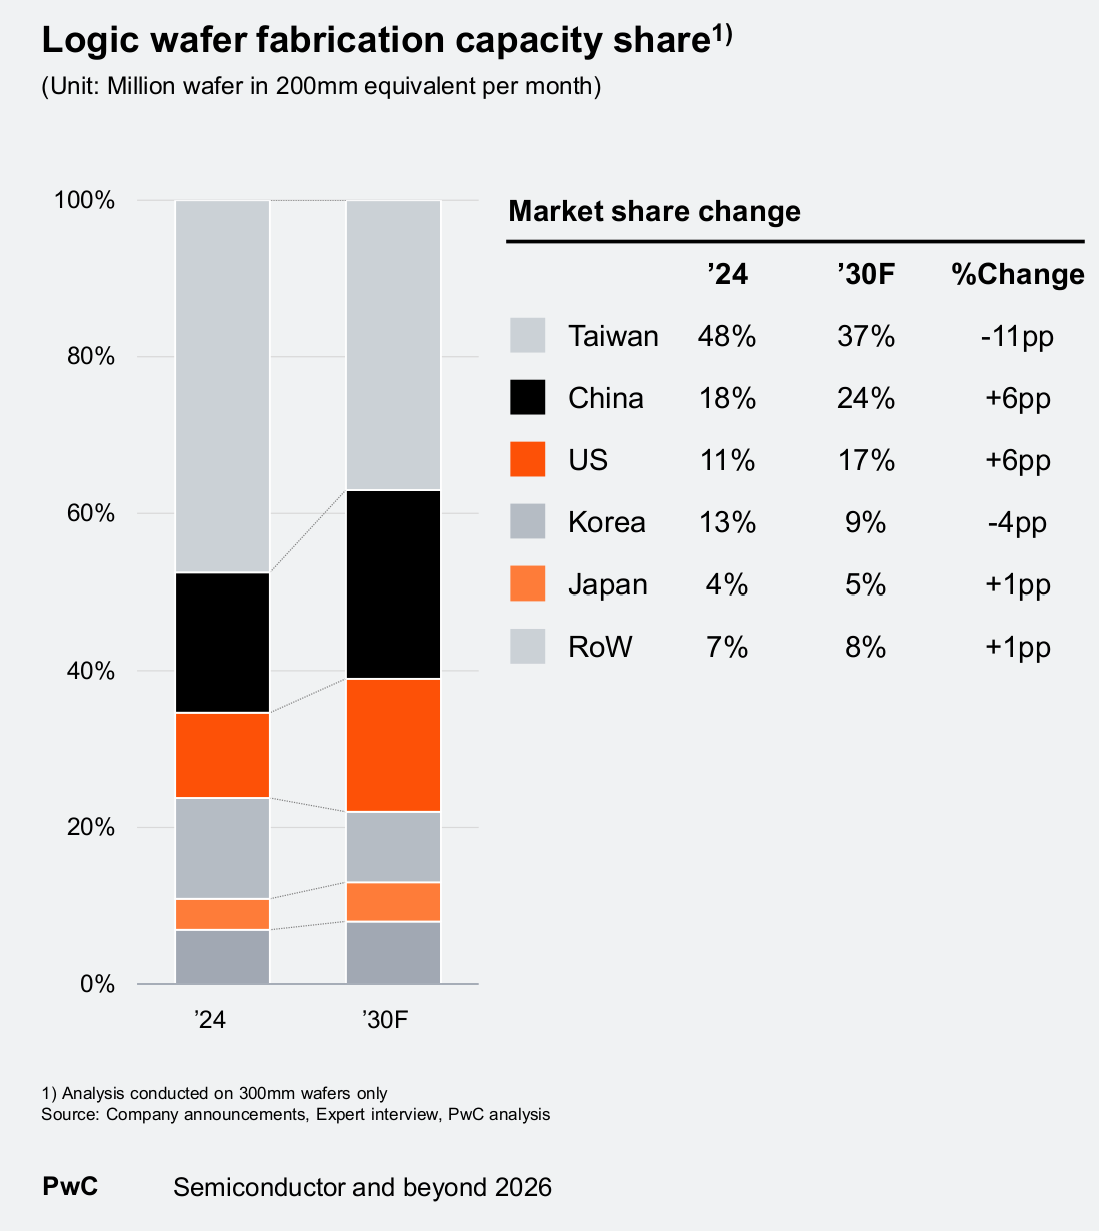
The US CHIPS Act is aimed at bringing advanced chip manufacturing back home. China, meanwhile, is doubling down on older, so-called mature-node chips—these are older-generation chips still widely used in cars, appliances, and consumer electronics. They remain a big market, and one where China can keep growing despite US export controls.
At the same time, Taiwan’s TSMC, South Korea’s Samsung and SK Hynix, and Japan, through projects like Rapidus and its joint venture with TSMC and Sony, are all scaling up. The result is supply chains that are more diversified but also more politicized.
Another big change is the shift from general-purpose chips to application-specific ones. These are custom-designed chips, known as ASICs, built for particular tasks. For example, some are designed only for AI training, while others are built just for car sensors.
Big tech companies like Google and Tesla are already designing their own, both to boost performance and to reduce dependence on outside suppliers. Automakers are following the same path, creating chips tailored for electric vehicles and self-driving systems.
US mutual fund industry trends
In earlier editions, we’ve focused on India’s mutual fund industry. This time, we’re looking at some fascinating charts from a Franklin Templeton report on the US and global mutual fund landscape.
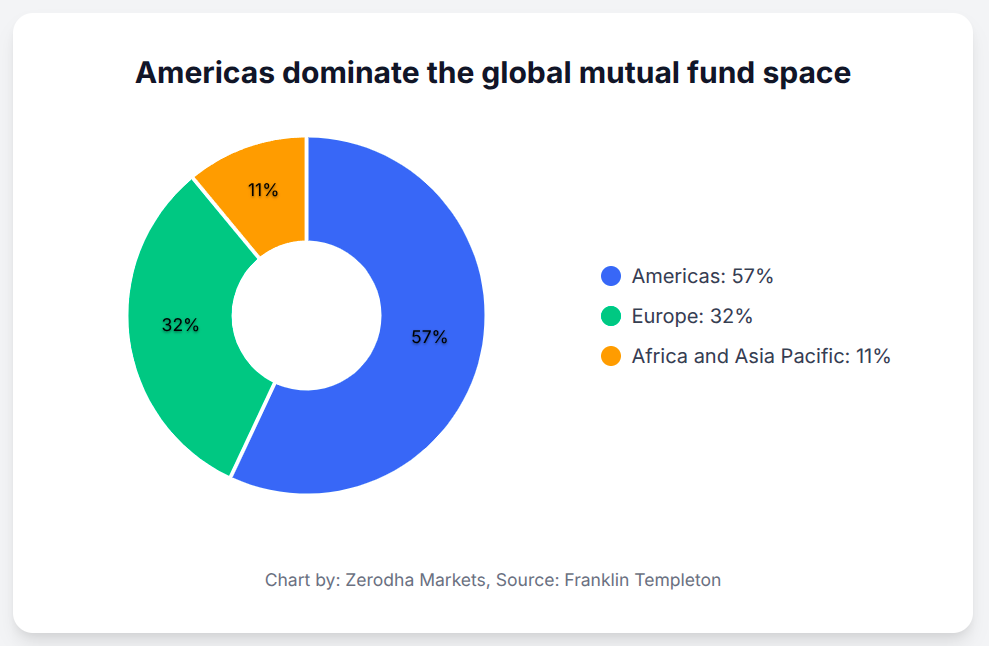
When we discuss mutual funds worldwide, it’s essentially a US story. The scale of the American market is staggering and makes the rest of the world look small in comparison. Globally, regulated open-end funds held about $74.5 trillion in assets in the first quarter of 2025. And the Americas—driven overwhelmingly by the US—account for the bulk of it.
The Americas account for about 57% of global mutual fund assets. Europe is far behind at 32%, and the entire Africa and Asia-Pacific region combined makes up just 11%.
In the US, mutual funds are central to how people save and invest. The report notes that 56% of American households hold mutual funds—that’s 127 million investors. It’s a level of participation that most other countries, including India, can only aspire to.
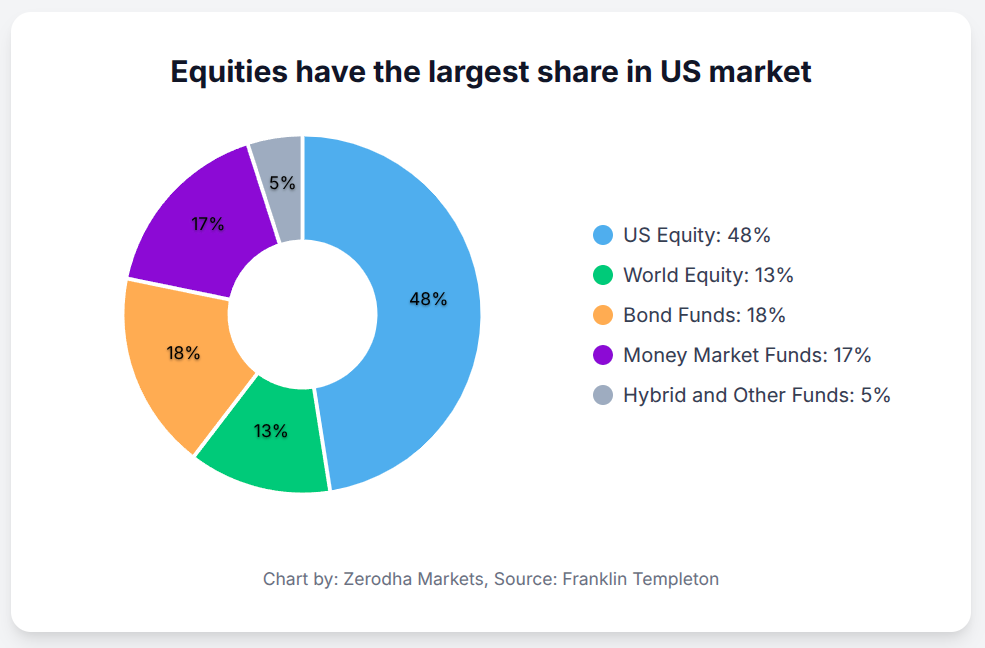
The scale is just as clear when you look at assets under management. US investors allocate heavily to equities. Together, US equity funds at 48% and world equity funds at 13% make up about 61% of the total. In contrast, bond funds at 18% and money market funds at 17% account for much smaller shares.
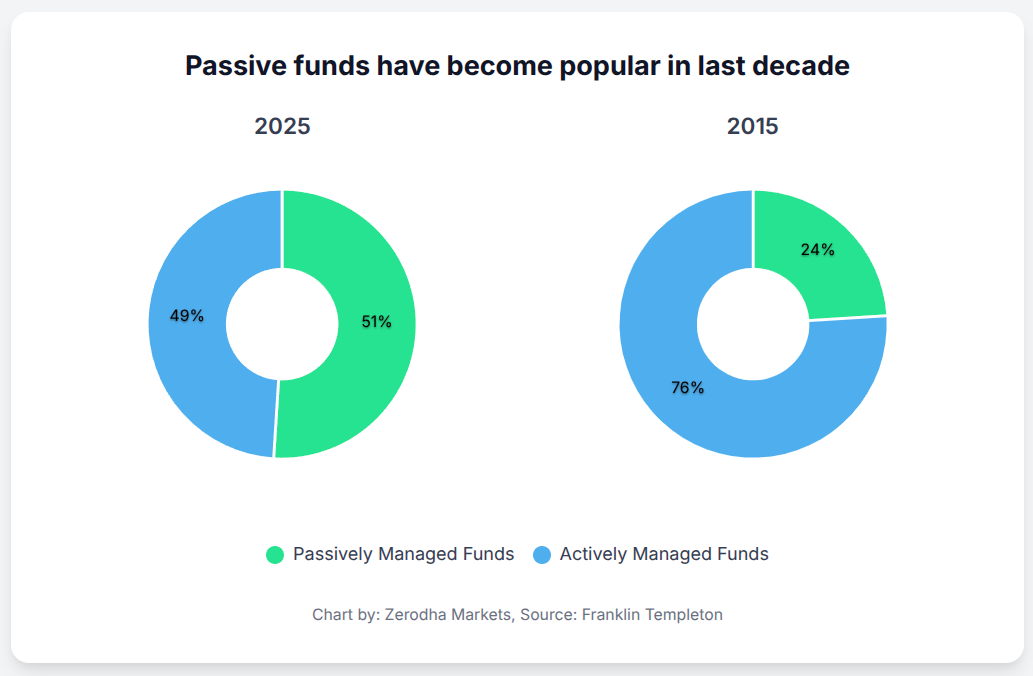
In 2015, actively managed funds dominated, holding about 76% of assets. Passive funds—mainly index funds and ETFs—made up the remaining 24%.
By 2025, that picture has flipped. Passive funds now hold the majority at 51%, while active funds have slipped to 49%. The big drivers have been lower costs, easier access through ETFs, and the fact that most active funds have struggled to consistently beat the market. It’s one of the most significant shifts in modern finance.
That’s it for this edition. Thank you for reading. Do let us know your feedback in the comments.
Amid the chaos faced by Chinese manufacturers in the solar industry, where do Indian companies like Waaree, Tata Power, or Premier Energies, etc stand?”