

Hello and welcome to Beyond The Charts. A series where we look at charts to make sense of what’s happening in finance and the economy and uncover the stories they tell.
Global uncertainty is on the rise, from new US tariffs to fiscal strains in advanced economies, but India so far has managed to hold its own. In this edition of Beyond The Charts, we will take a look at some insights from RBI’s September Bulletin and some interesting charts on the Indian economy.
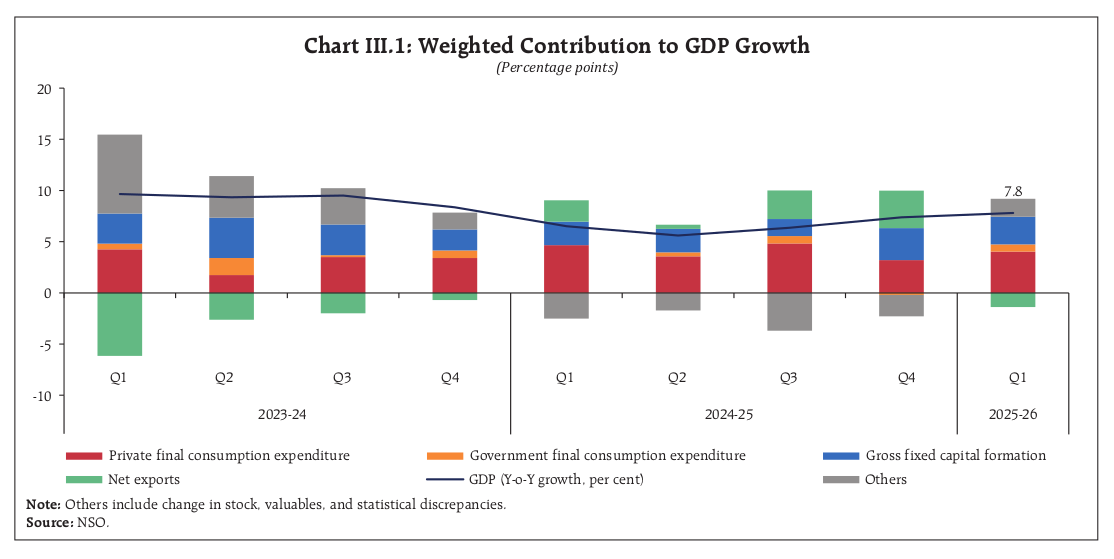
Let’s start with India’s economic growth. Both reports converge on one theme: the economy is being driven from within. In the first quarter of FY26, GDP grew 7.8%. Most of that came from private consumption and fixed investment—in simple terms, people spending more on goods and services, and businesses putting money into factories, housing, and infrastructure. On the other hand, trade dragged growth down, since imports were higher than exports.
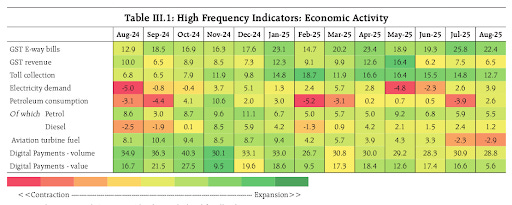
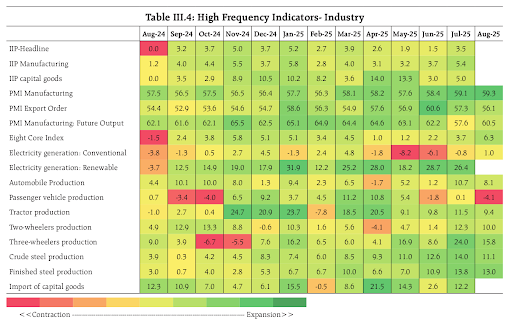
The high-frequency indicators tell a similar story. GST e-way bills, power demand, and toll collections all grew strongly in August. But there’s more to those numbers than meets the eye. Part of the growth came from festive stocking—companies moving goods early to get ready for the upcoming festival season, when demand usually jumps. Another factor was exporters rushing shipments ahead of new US tariffs, trying to soften the impact of higher import duties by sending goods before the hikes took effect.
Rural revival, Urban softness
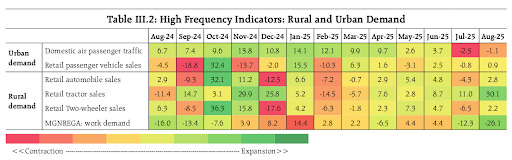
Shifting to demand patterns, there’s a clear change. Demand in Rural India is picking up again, something we discussed in the previous edition of Beyond The Charts. Tractor and two-wheeler sales rose in August, more farm jobs opened up with kharif sowing, and demand for MGNREGA dropped. Good rains and healthy reservoirs supported sowing and also helped keep food prices in check.
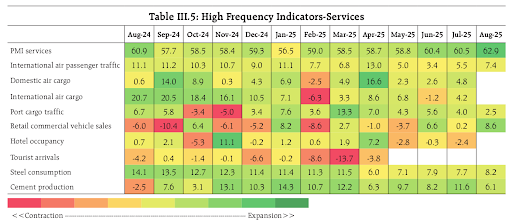
Urban India, on the other hand, looks weaker. Car sales were modest, and domestic air travel actually fell. That’s the opposite of the trend seen from 2021 to 2024, when cities were driving growth while villages struggled with high inflation.
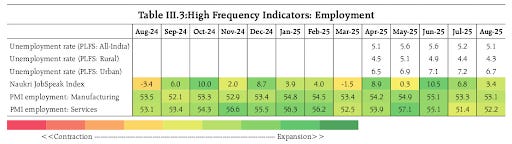
Coming to employment trends. The unemployment rate fell to 5.1% in August, mainly because urban unemployment dropped. More people are joining the workforce, and hiring is steady in areas like technology, insurance, hotels, outsourcing, and real estate. Business surveys also show companies are still adding workers in both the manufacturing and services sectors.
Trade: Narrowing deficit, fragile cushion
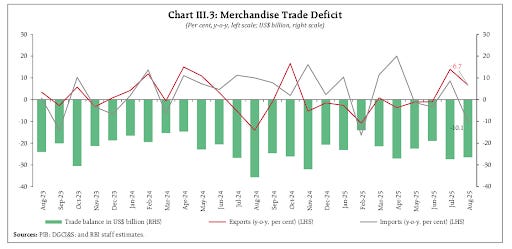
When we look at India’s trade with the rest of the world—what economists call the external sector—the picture is mixed. On the goods side, India usually runs a deficit, since imports of oil, electronics, and gold outweigh exports. In August, though, the gap narrowed sharply,
At $26.5 billion, it was much smaller than the $35.6 billion deficit a year earlier. Exports of engineering goods, petroleum products, electronics, gems and jewellery, and pharmaceuticals all rose. Imports fell in gold, coal, and transport equipment. Oil imports did go up, but not enough to undo the overall improvement.
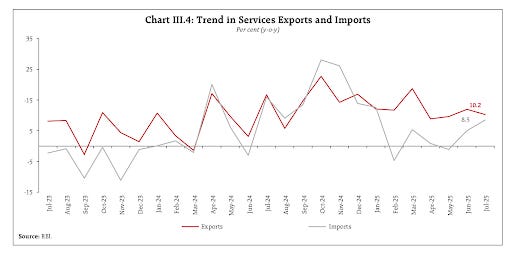
Services are a different story. India usually earns more from services than it spends, mainly because of IT and business outsourcing. In July, net services exports rose 10.2% year on year to $16.4 billion. Imports also grew, mostly from travel and royalty payments, but the surplus stayed strong, just as it has since the mid-2010s. The RBI warns, though, that weaker global IT spending, automation, and tighter visa rules could put this cushion at risk.
Inflation: calm, but watch food
Now let’s look at inflation. Consumer price inflation in August was just 2.1%, comfortably below the RBI’s 4% target. On the food side, the picture was mixed. Prices of cereals, fruits, and milk cooled, while vegetables, pulses, and spices were still in deflation.
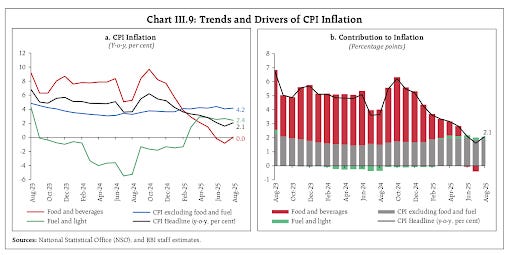
Fuel inflation also eased—electricity and kerosene got cheaper, though LPG prices remained high.
Core inflation, which strips out food and fuel, ticked up slightly to 4.2%. That was mostly because of higher gold prices, even as inflation in housing, clothing, health, and transport softened.
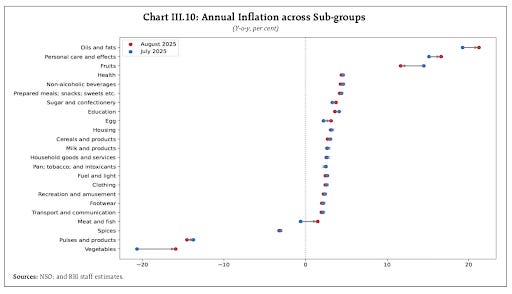
But the RBI warns the risks aren’t gone. Pulses and onions are still volatile, high-frequency data already show cereals picking up in September, and higher wages could add to costs through what it calls “second-round effects.” In other words, the headline number looks calm, but for households, kitchen bills still feel heavy.
Industry and Services
Industrial activity is holding firm. The eight core sectors grew strongly in August, with steel and coal showing double-digit gains, cement rising, and electricity steady. The manufacturing PMI even touched an 18-year high — a clear sign of infrastructure build-out. But the RBI points out that much of this momentum is coming from government capital spending, while private investment still hasn’t fully returned.
Services are doing well too. The services PMI climbed to its highest level in 15 years, with air travel, commercial vehicle sales, digital payments, rail freight, and port cargo all expanding. Since 2020, services have been the most reliable driver of growth. But because they depend so much on urban incomes, they remain vulnerable to any slowdown in jobs or wages.
Credit, capital flows, and buffers
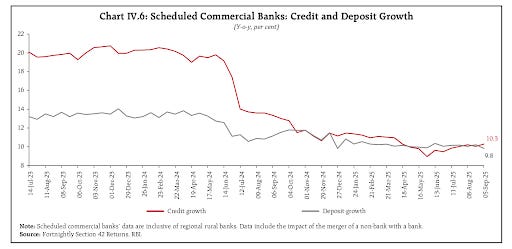
Let’s look at the financial system. Bank credit growth eased to around 10% year on year in early September. Retail loans—housing, gold, and personal loans—remain the main driver.
Credit to services was also strong, led by trade and real estate. MSME credit grew too, though industrial lending is still patchy.
Deposits growth, on the other hand, slowed a bit to 9.8%.
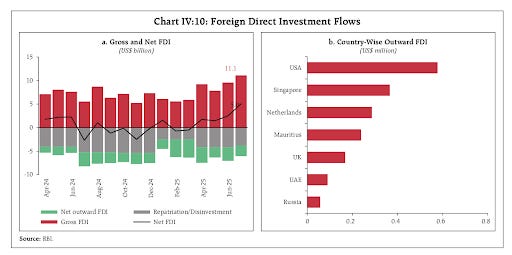
On external flows, FDI touched $10.7 billion in April to July, with July alone hitting a 38-month high of $5 billion. But most of this came from one big services deal, not a broad surge.
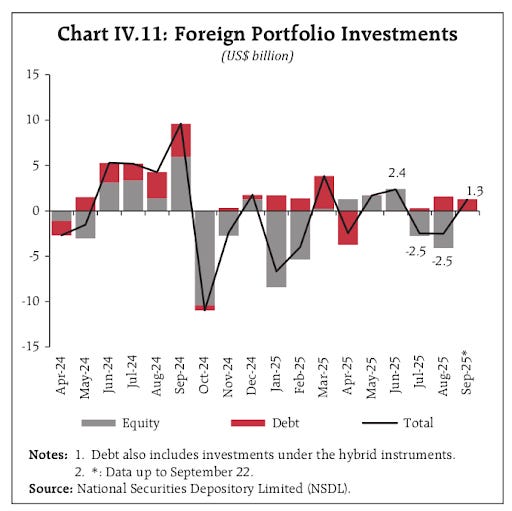
Foreign portfolio flows remain volatile. August saw equity outflows on tariff fears, but debt inflows after India’s credit rating upgrade. By mid-September, overall flows turned positive again, boosted by debt inflows after the US Fed’s rate cut.
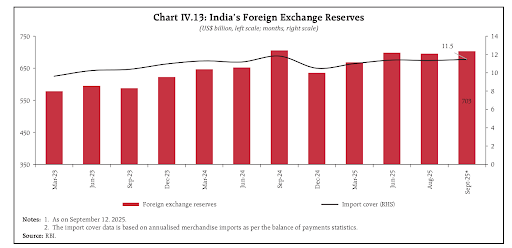
Reserves remain a strong cushion. At $703 billion in mid-September, they cover more than 11 months of imports and 95% of external debt. The RBI has dipped into them to smooth rupee volatility, but the buffer is large enough to absorb oil shocks or sudden outflows.
Financing the economy: banks, markets, foreign funds
The flow of funds shows how India’s financing model is shifting. Put simply, this is about where businesses get their money from, whether through bank loans, markets, or overseas sources.
In FY25, bank lending slowed, with non-food credit — loans that banks give to companies and households — down by about ₹3.4 lakh crore. But that gap was more than made up by non-bank sources, which rose by ₹4.5 lakh crore. Together, total money flowing into the commercial sector reached ₹35.1 lakh crore.
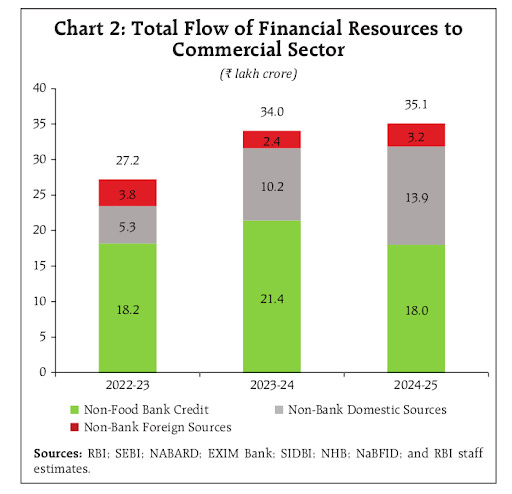
Markets are now supplying nearly as much finance as banks — about ₹14 lakh crore compared with ₹18 lakh crore. In FY25, companies raised about ₹14 lakh crore from the markets compared with ₹18 lakh crore from banks.
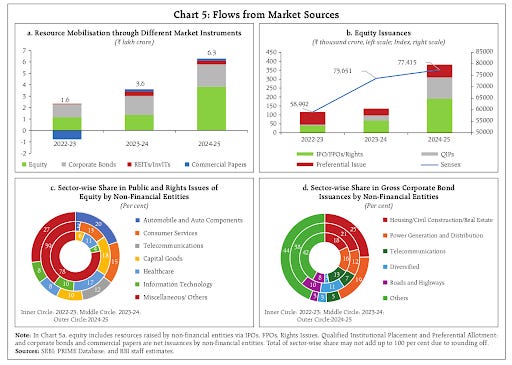
How did they do this? Equity fundraising surged, as companies sold new shares. Corporate bond issuance grew as interest rates eased, making borrowing cheaper. Commercial paper, that is short-term debt issued by firms, also saw a revival. And while smaller in size, REITs and InvITs (used to fund real estate and infrastructure) added steadily to the pool.
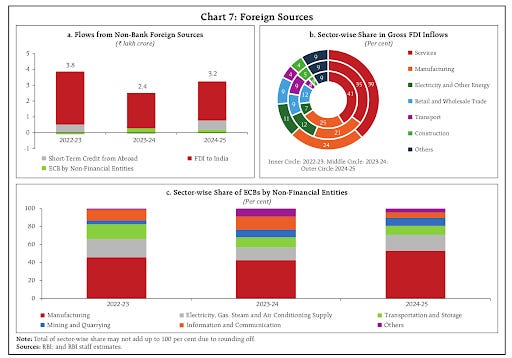
Foreign sources are still an important piece of India’s funding story. Most of this comes in the form of FDI—long-term investments by global firms — which consistently make up the largest share. ECBs, or external commercial borrowings, and short-term trade credit play a role, but they’re much smaller compared to FDI.
Where does this foreign money go? The breakdown shows that services dominate FDI inflows, taking close to 40% in 2024–25. Manufacturing comes next, with about one-fifth of the total, while energy, retail trade, and construction each take smaller shares. For external borrowings, companies in manufacturing are the largest users, followed by power, transport, and communication.
The takeaway here is, the Indian businesses are no longer as dependent on bank loans as they once were. Markets and foreign investors now provide a large share of funding.
NBFCs: Stronger, but still bank-tied
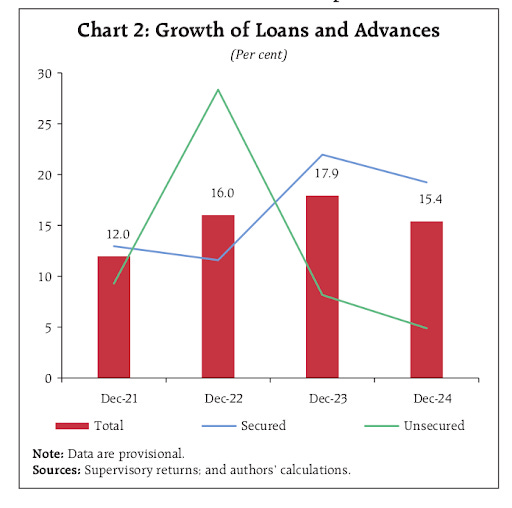
Non-Banking Financial Companies (NBFCs) like banks are also seeing lower loan growth, Loan growth slowed to 15.4% by end-2024, after the RBI raised risk weights on unsecured lending.
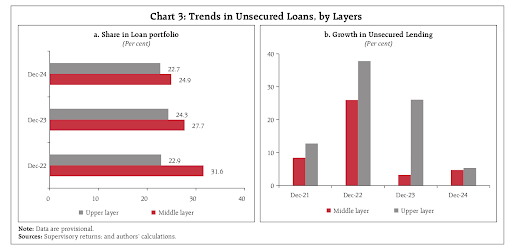
As a result, unsecured loans now make up a smaller share of their portfolios, down to around 24%.
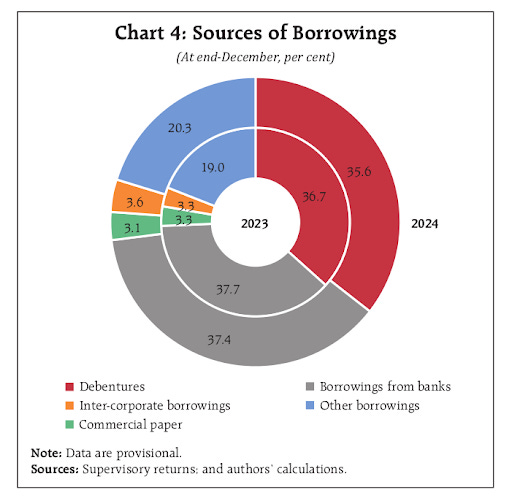
On the funding side, NBFCs still rely heavily on the banking system. Banks and debentures together make up 73% of their borrowings.
On the lending side, credit is split—with industry loans concentrated in the power sector, and retail lending spread across housing, vehicles, and consumption.
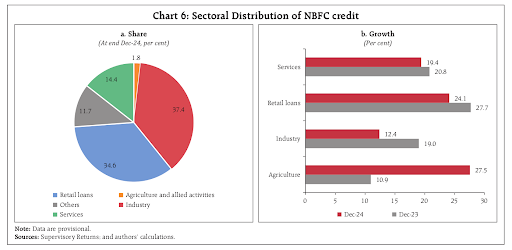
The sector is also in far better shape than it was in 2018. Gross NPAs have dropped to 3.4%, net NPAs to 1.2%, capital buffers are high, and liquidity coverage is well above regulatory norms. Still, the RBI warns that microfinance NBFCs and fintech-focused lenders are the most vulnerable if credit conditions tighten.
Public spending
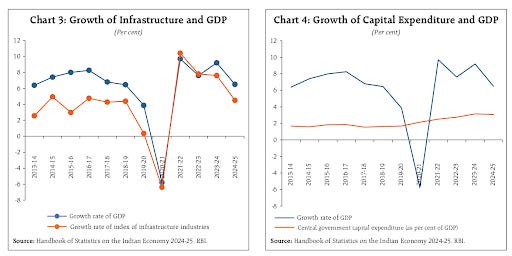
Finally, let’s turn to government spending. Central capital expenditure has climbed to 3.1% of GDP in FY25, the highest in decades, with roads, defence, and logistics leading the way. The RBI notes this spending has been front-loaded, with more funds released early in the year to push activity.
Looking at the data, infrastructure growth has generally moved in line with GDP growth in recent years. Both slumped during the COVID shock, bounced back sharply in 2021–22, and have since moderated but remain closely linked.
There’s also a clear pattern over time: when government capex rises, GDP growth tends to improve later. That’s why policymakers today are leaning so heavily on public investment as a growth driver.
The challenge, however, is sustainability. Pushing capex higher with limited fiscal space risks swelling the deficit, meaning that while public spending can keep growth going, it cannot carry the burden alone indefinitely.
So the story across all these charts is clear. India’s growth today rests on people spending more, businesses investing, services firing, banks and NBFCs holding steady, and record government capex. The weak links are trade, food inflation risks, and the fact that private investment still hasn’t fully joined in. India may be holding its ground better than most, but the real test is whether these domestic engines can keep running.
That’s it for this edition. Thank you for reading. Do let us know your feedback in the comments.