

Hello and welcome back to Beyond The Charts. A series where we break down what's happening in the world of finance and the economy through charts in a way that's easy to understand.
AMFI recently released the mutual fund inflow data for June, and now that we're halfway through 2025, it's a perfect time to see how investors have been reacting to markets.
A lot has happened in the past six months, from rising tariff tensions to ongoing conflicts in different parts of the world. These events have kept global markets nervous, and Indian markets have felt some impact too. Looking at mutual fund flows can give us insights into investor sentiment and confidence.
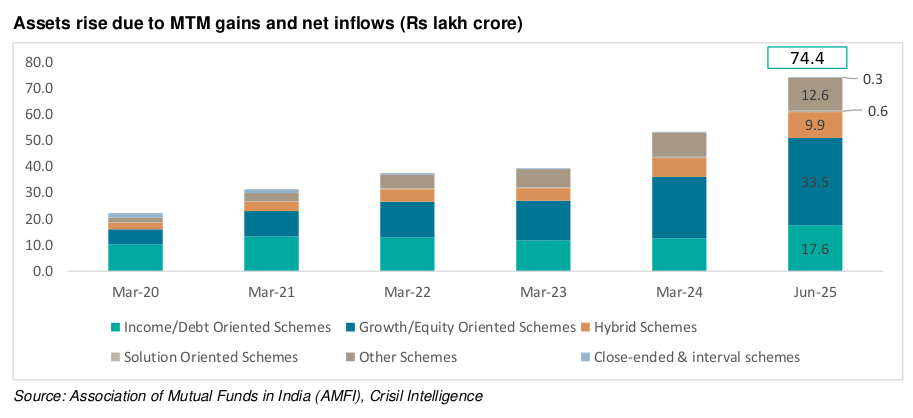
Between January and June, mutual fund assets under management (AUM) grew by over ₹7 lakh crore, from ₹67.25 lakh crore to ₹74.41 lakh crore—a growth of about 11%. This was driven mainly by the rise in the value of existing investments and fresh investments across categories. Overall, the mutual fund industry saw inflows of around ₹4.18 lakh crore during this period.
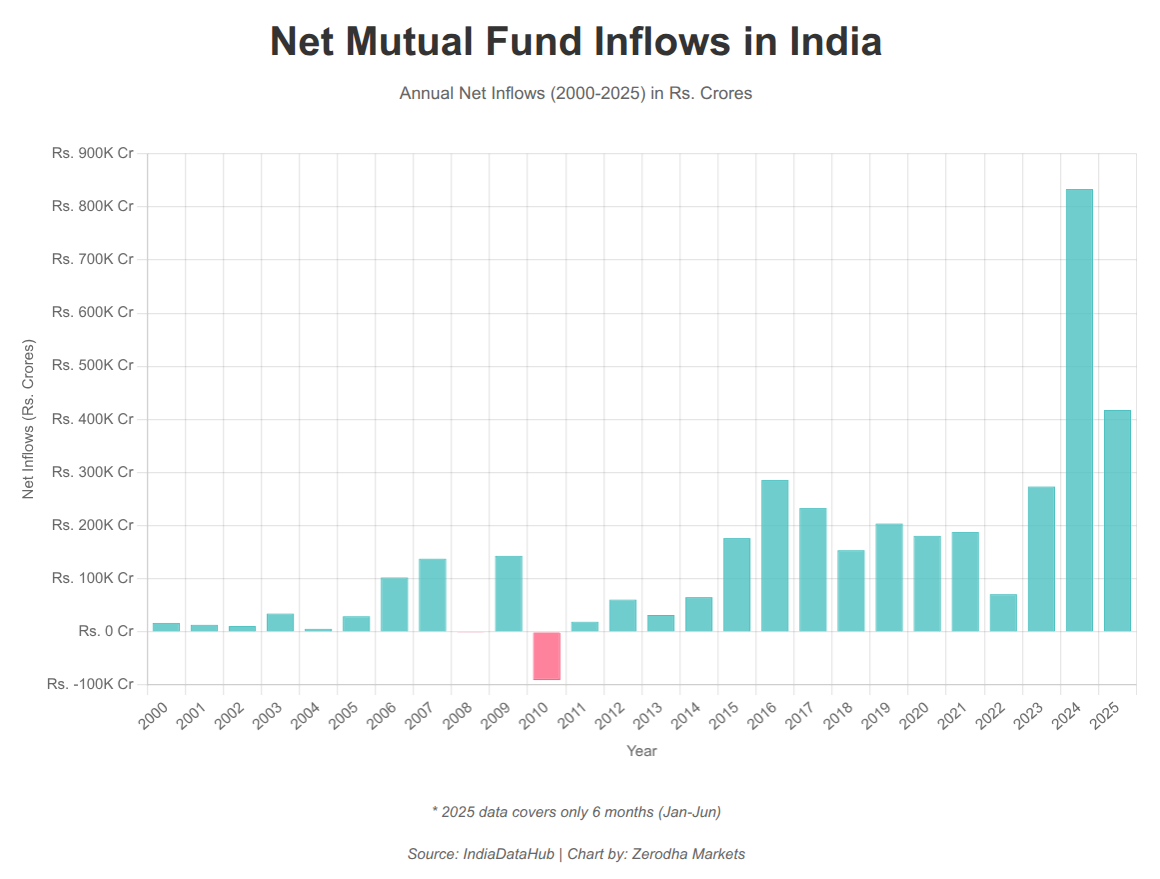
Interestingly, compared to annual inflows recorded since 2000, 2025 already stands out. Excluding 2024, the inflows seen in just the first six months this year exceed the full-year totals of most previous years.
So, let’s break down the numbers across equity, debt, and hybrid funds and see what they tell us about how investors are thinking in this kind of market.
Equity mutual funds
Of those ₹4.18 lakh crore worth of inflows this year, ₹1.6 lakh crore has been towards equity mutual funds. This has seen a steady stream of funds coming in since 2021; in fact, despite multiple periods of economic uncertainties post-COVID, flows into equity funds have remained positive ever since.
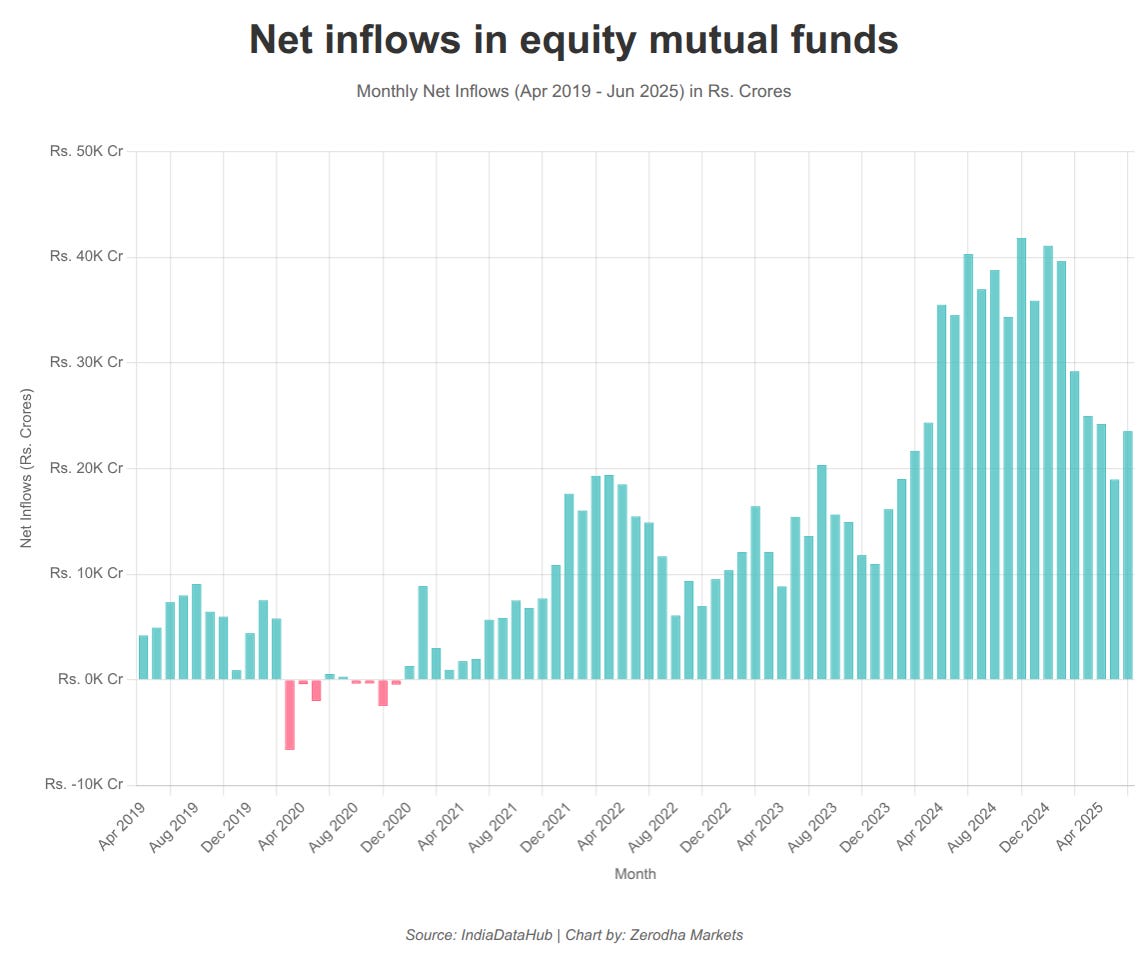
However, recently there's been a slowdown, from an average of ₹35,000-₹40,000 crore between May 2024 and January 2025, to around ₹24,000 crore monthly since February. Yet, equity fund AUM continues to rise, reaching ₹33.47 lakh crore in June from ₹29.5 lakh crore in January.
Interestingly, despite the moderation, equity fund AUM has steadily grown every month this year, from ₹29.5 lakh crore in January to ₹33.47 lakh crore in June.
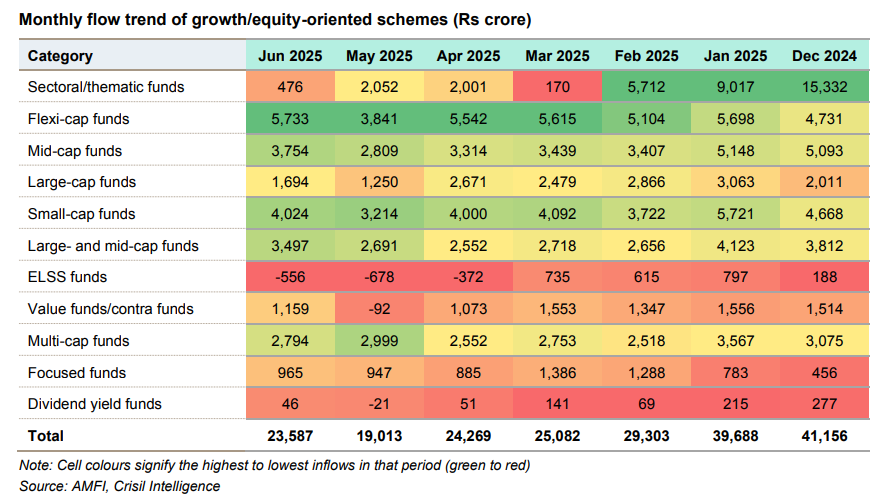
One big reason for this fall is the sharp decline in flows in sectoral/thematic funds. In December, these funds pulled in over ₹15,000 crore, far more than any other category. But by June, that number had decreased to just ₹476 crore.
At the same time, categories like flexi-cap and mid-cap funds are still holding up well. Flexi-cap funds have received consistent inflows throughout this year, with June bringing in ₹5,733 crore, the highest among all categories. Other categories that have seen stable inflows have been mid- and small-cap and multi-cap funds.
Thematic losing shine?
Thematic funds had become hugely popular as investors rushed to bet on specific sectors like infrastructure, defense, green energy, tourism, and more. Since July 2023, they’ve pulled in nearly ₹2 lakh crore, about a third of the ₹6.5 lakh crore that flowed into equity mutual funds during the same period.
But that momentum has faded. In the last four months, inflows have slowed to just ₹4,500 crore. This could be due to rising uncertainty from global tariff tensions, making investors more cautious about concentrated sector bets.

Performance can be another factor. While these themes delivered strong returns over the past three years, recent performance has been underwhelming. In the last year, only three thematic categories have posted double-digit returns on average, and in 2025 so far, just one has managed to do so.
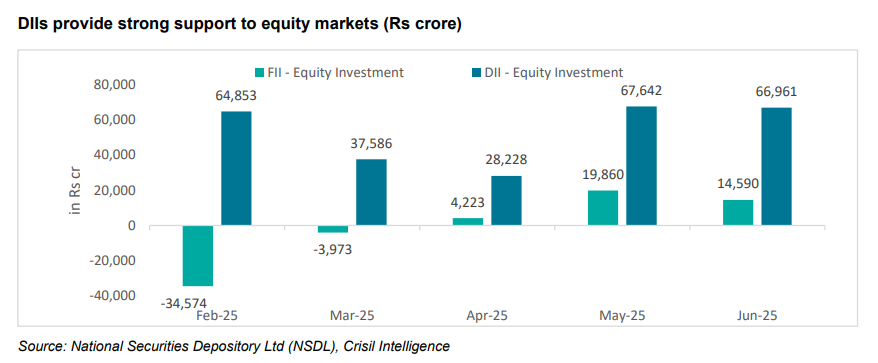
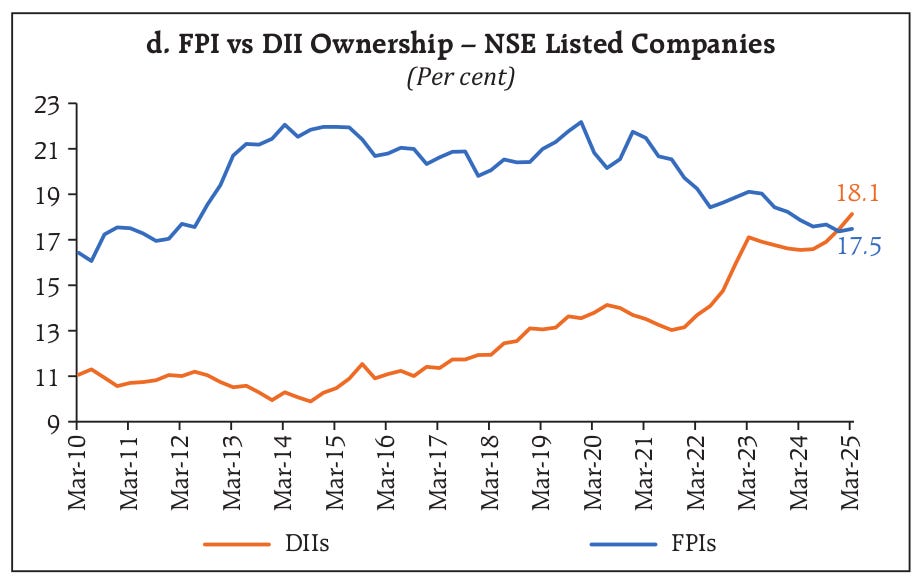
DIIs on the rise
Here's something interesting: consistent inflows into mutual funds have boosted the share of Domestic Institutional Investors (DIIs) in Indian equities. DIIs now hold an 18.1% share, surpassing Foreign Institutional Investors (FIIs), who hold 17.5% as of March 2025.
Debt and Hybrid funds
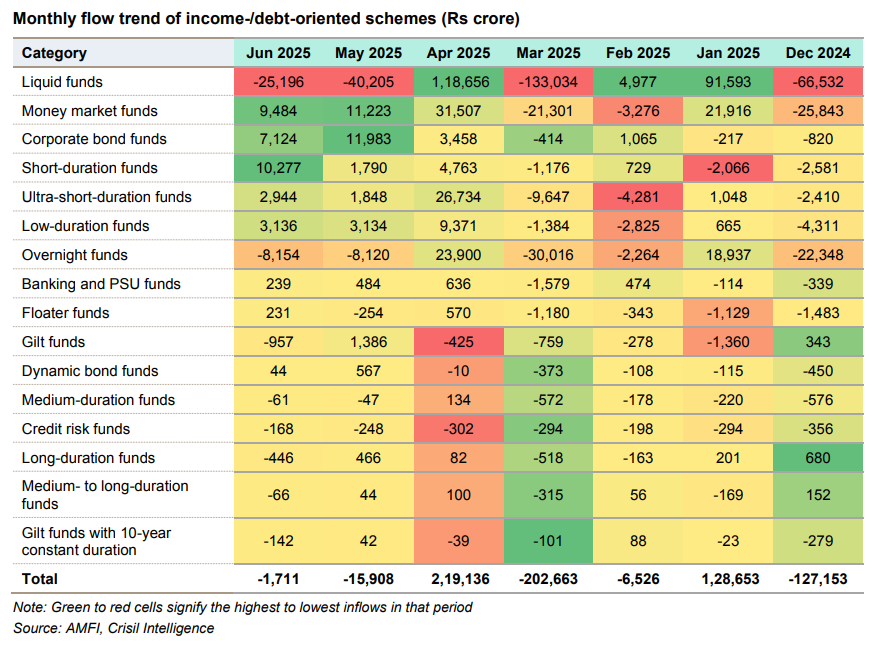
Debt fund flows have been volatile. In April 2025, there was a huge spike in inflows, ₹2.19 lakh crore, mainly because companies park surplus money in liquid and money market funds at the end of the financial year for a short period. That’s a seasonal trend. But once that money is withdrawn after year-end payouts or tax payments, flows reverse. That’s what happened in May and June, where liquid funds alone saw combined outflows of over ₹65,000 crore, dragging total debt flows into negative territory.
However, some categories are seeing good interest from the falling interest rate cycle. With the RBI cutting the repo rate by a full percentage point in 2025 so far, most recently to 5.5% in June, short-duration funds and corporate bond funds, which tend to benefit as rates decline, saw strong inflows of ₹10,277 crore and ₹7,124 crore in June. Meanwhile, overnight and ultra-short duration funds continued to see outflows as their relative returns become less attractive in a falling rate environment.
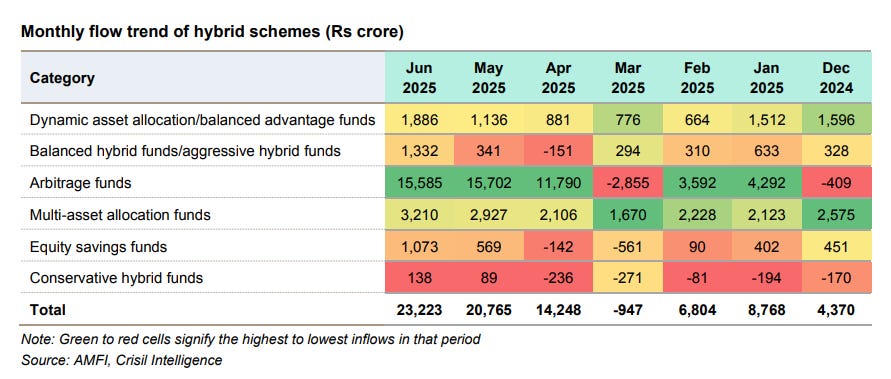
Flows in hybrid funds, on the other hand, have been steady and have increased from ₹4,370 crore in December 2024 to ₹23,223 crore in June 2025. Arbitrage funds are driving most of this growth, with ₹15,585 crore coming in June alone. These funds benefit from market volatility, earning returns from price differences in the cash and futures segments. With markets being choppy, they’ve become a preferred low-risk option for many investors.
Also, seeing strong inflows are multi-asset and dynamic asset allocation funds, which offer a mix of equity, debt, and even gold. With equity markets volatile and debt returns becoming unattractive following rate cuts, investors seem to prefer balanced options that adjust exposure based on market conditions.
Notably, hybrid fund AUM grew 13% in the first half of the year, while debt funds remained relatively flat.
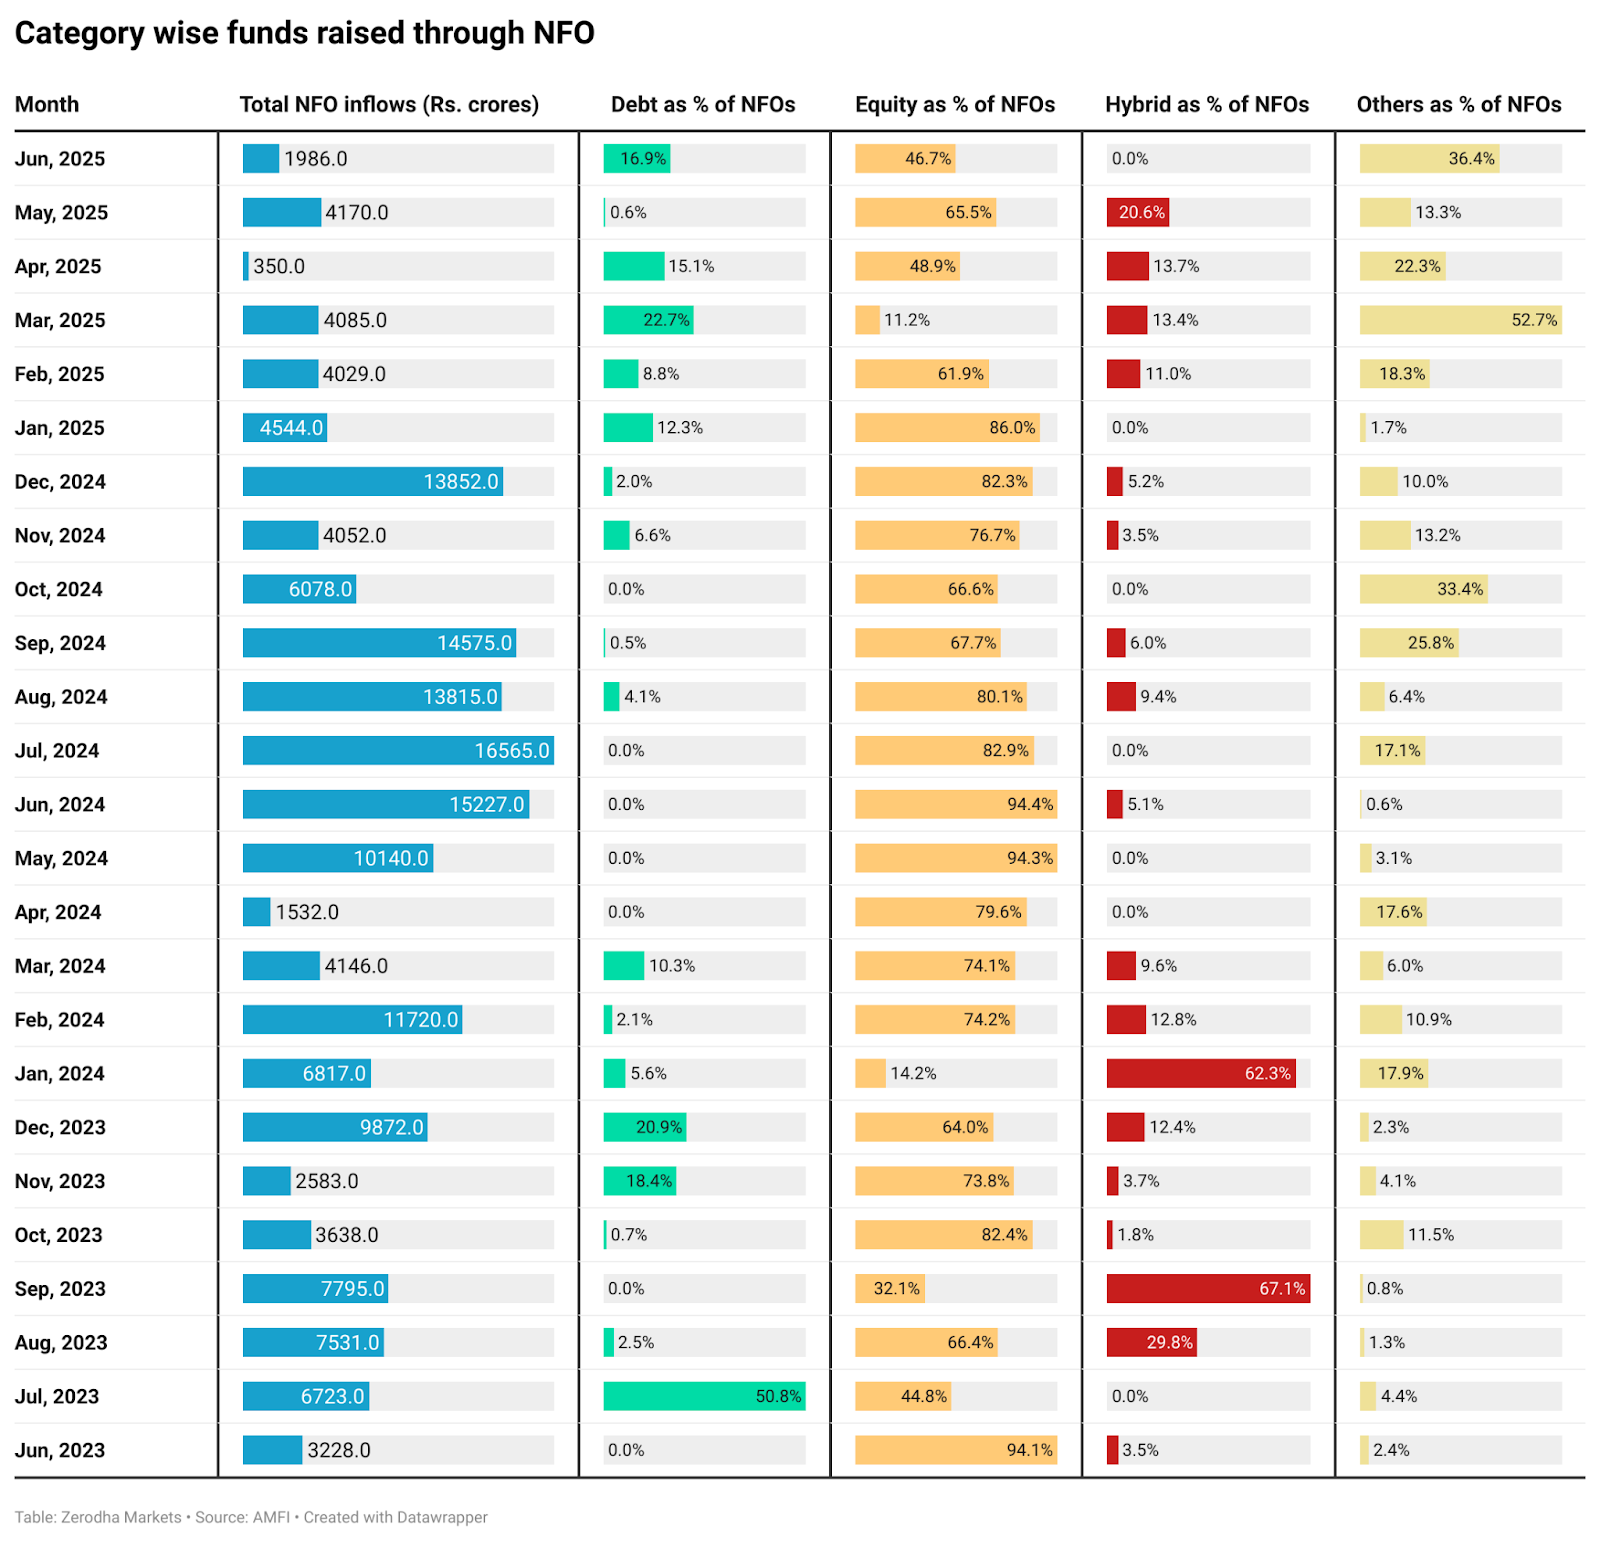
No bulls, no NFO party
Meanwhile, as the markets have seen some correction and increased volatility, the funds raised through New Fund Offerings (NFOs) have sharply declined. From average monthly collections of ₹10,000 crore in 2024, they dropped to around ₹3,100 crore per month this year.
Passive
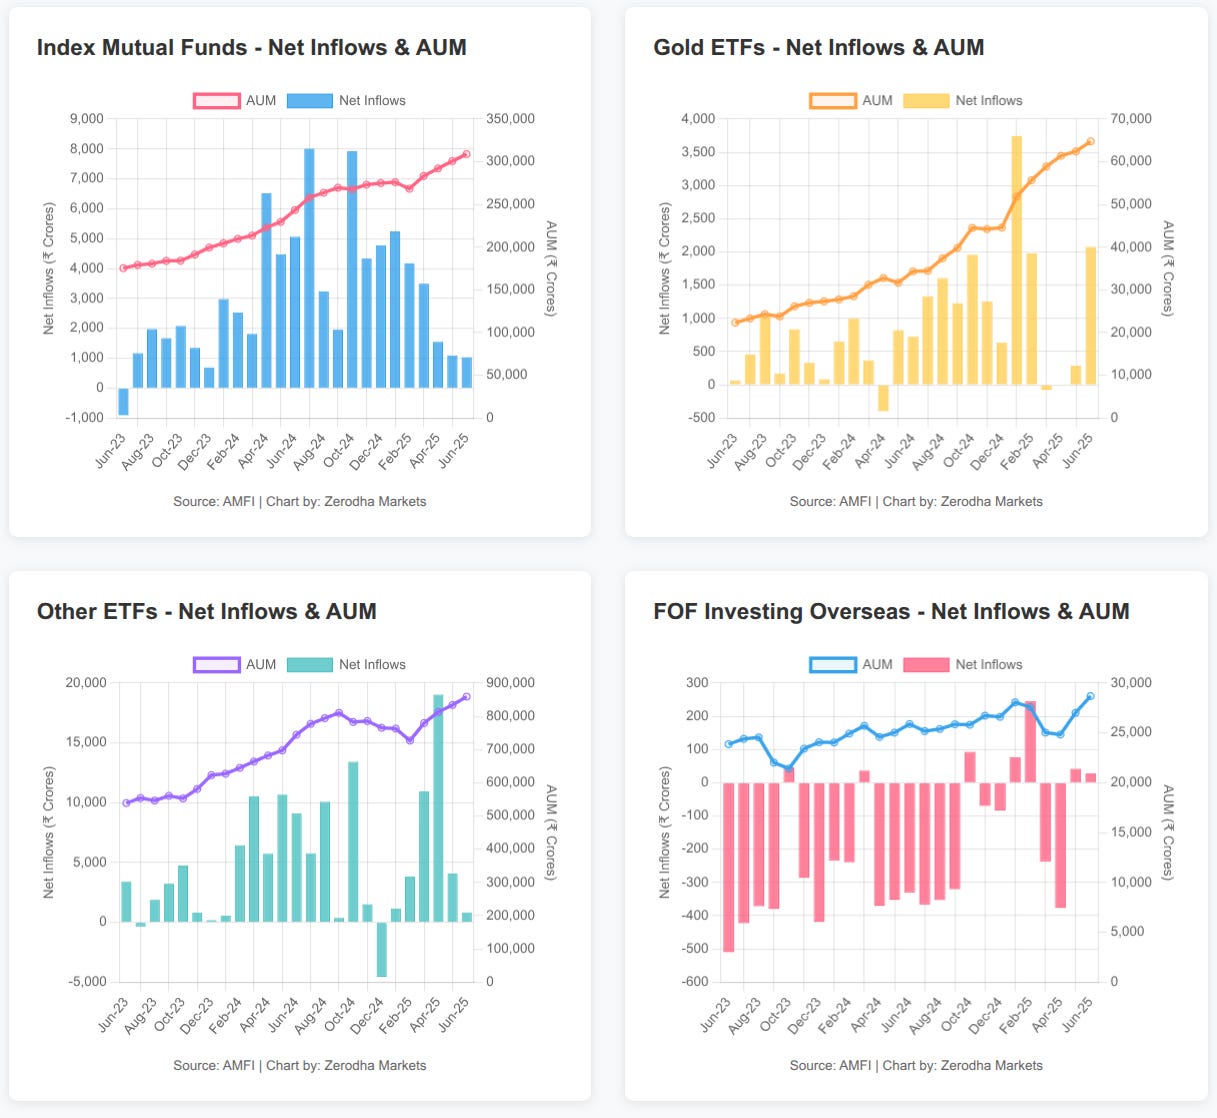
While active equity and hybrid funds continue to see steady inflows, let’s take a look at how passive funds, like index funds, ETFs, and overseas fund-of-funds, are doing.
First, index mutual funds, which aim to mirror the performance of benchmark indices like the Nifty or Sensex, saw strong interest in 2024, averaging around Rs. 4,000 crores in monthly inflows. But since earlier this year, flows have slowed down, dropping below ₹2,000 crore in June. Despite this, assets under management (AUM) have steadily climbed to around ₹3.4 lakh crore.
Gold prices have been on a tear since the second half of 2024, rising from around ₹63,000 per 10 grams to even crossing the ₹1 lakh mark. This rally has been driven by global uncertainty, geopolitical tensions, and strong central bank buying. This interest in gold has also reflected in Gold ETFs. While these aren’t the default way most Indians invest in gold, physical gold still remains more popular; ETFs have managed to pull in over ₹19,000 crore in inflows, with AUM crossing the ₹65,000 crore mark.
Other ETFs, which include everything beyond gold and index, such as sectoral or strategy-based ETFs, have seen inconsistent flows. There were strong inflows in March and April, but they have been subdued in the rest of the months.
Funds of Funds (FOFs) that invest in overseas assets have had a rough ride. For most of the past year, they’ve seen net outflows, a trend that started after SEBI restricted fresh inflows into international FOFs in early 2022 due to the overall overseas investment limit set by RBI. Despite some leeway allowed later, flows have only slightly recovered since.
SIP trends
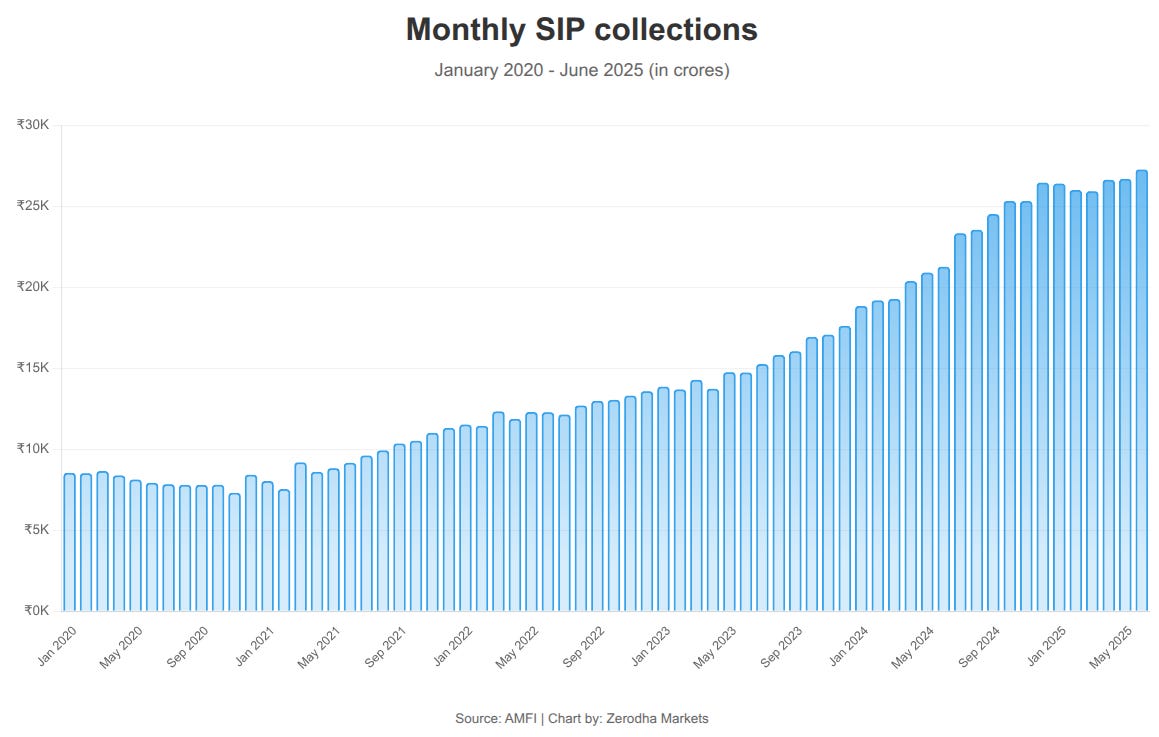
Systematic Investment Plan (SIP) inflows have stayed strong, consistently above ₹20,000 crore since May 2024, hitting a record ₹27,269 crore in June 2025. However, there's a caveat—these numbers don't factor in redemptions, so we don't get a clear picture of what's really happening.
AMFI provides data on SIP registrations and discontinuations; this should give us some insights into the investor behavior.
While SIP collections hit a record ₹27,269 crore in June 2025, the numbers beneath tell a different story. The discontinuation ratio has jumped from 58.7% in June 2024 to 77.8% in June 2025. Put simply, for every 100 new SIPs started, about 78 are being stopped or discontinued.
There is also a large spike in discontinuations in April this year, with 1.62 crore discontinuations. Though that's largely due to AMFI revising its counting method based on SEBI guidelines, where SIPs with 3 consecutive failed installments for monthly plans, or 2 for other frequencies, are marked as discontinued, which resulted in this one-time spike.
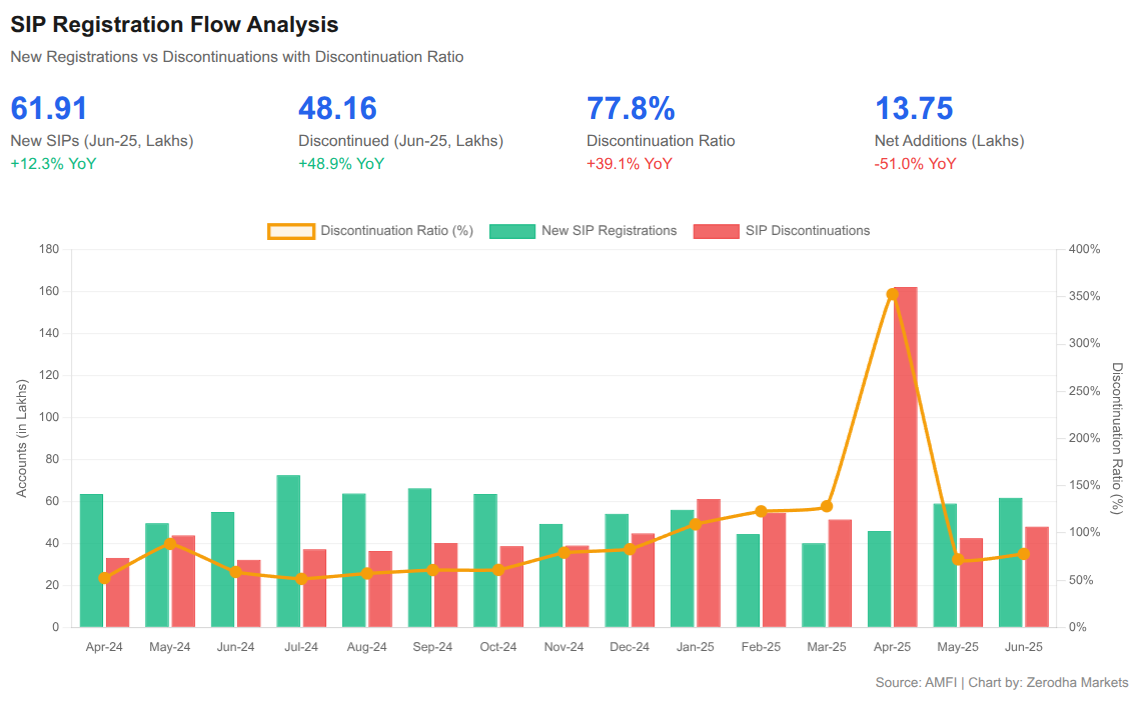
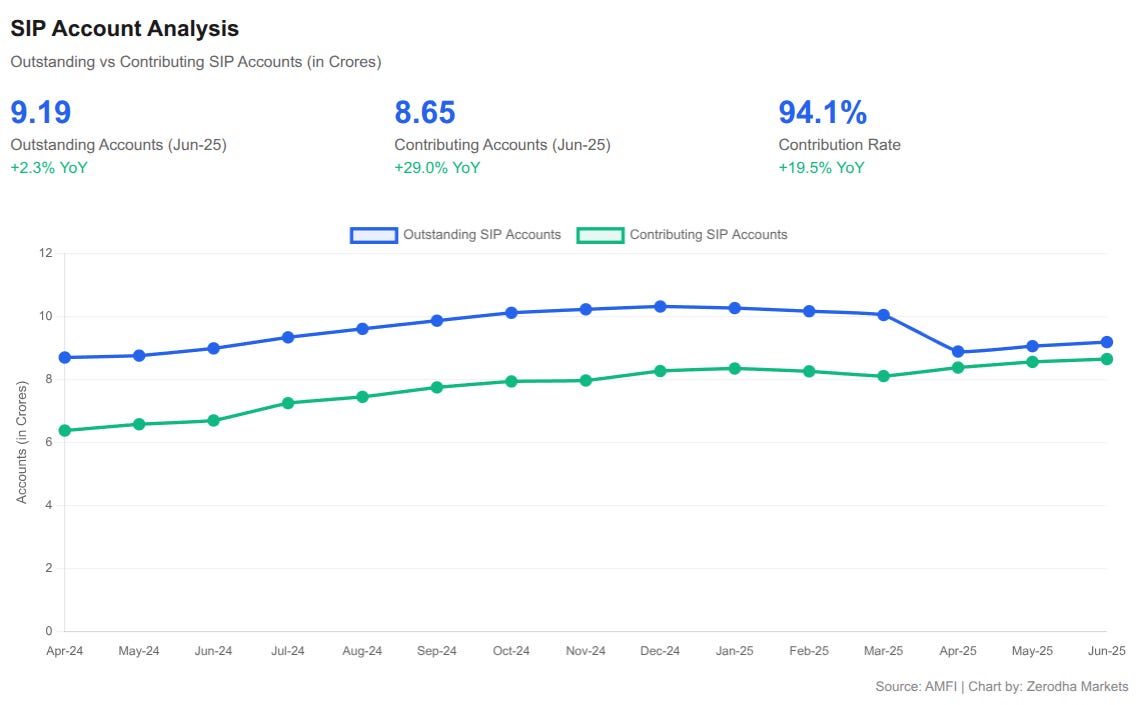
Even accounting for this. Net monthly additions have fallen by half compared to last year. June 2025 saw only 13.75 lakh net new SIP accounts versus 22.78 lakh in June 2024. Yet, SIP assets under management grew 23% YoY to ₹15.31 lakh crore. This suggests that existing investors are increasing their monthly contributions instead of new investors joining in.
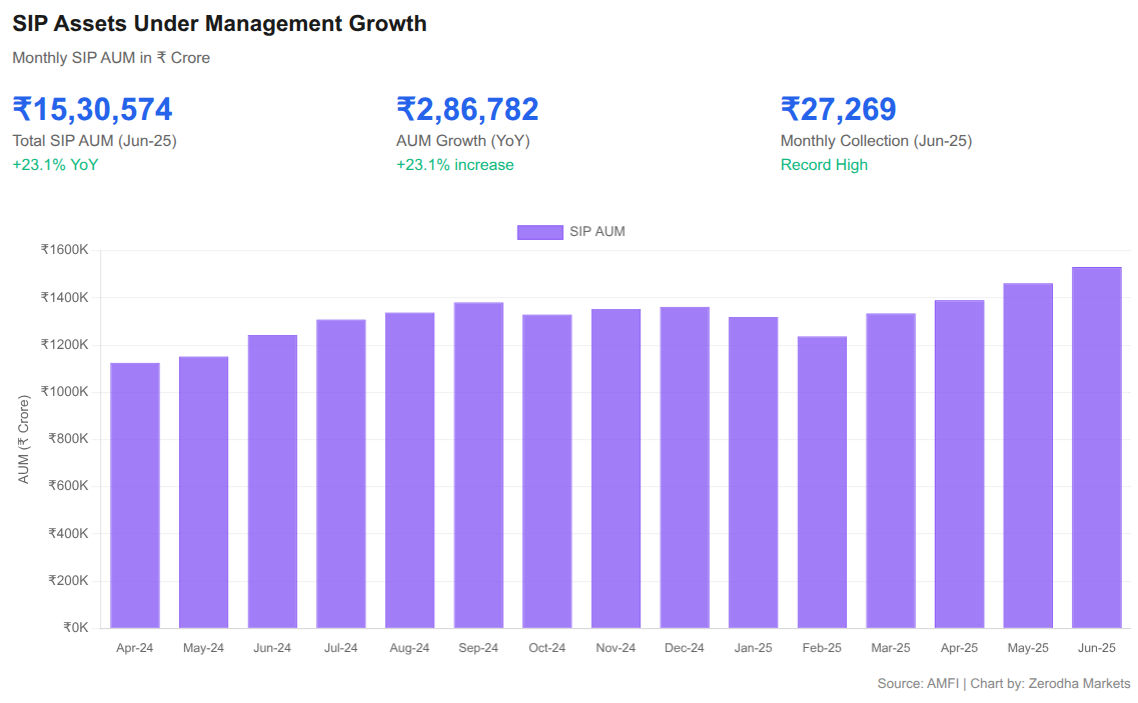
The contribution rate, which measures the ratio of actual payments to total accounts, improved from 74.6% to 94.1%, indicating better quality despite a lower quantity of contributions.
AMFI's annual report gives us some really good insights into investor behavior when it comes to SIPs.
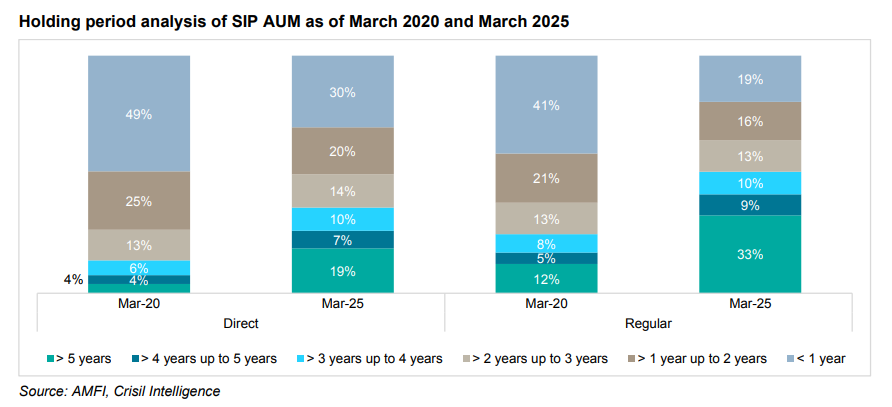
Regular plans still lead the way when it comes to long-term SIP discipline. As of March 2025, one in three SIPs in regular plans had been held for more than five years, up from just 12% in 2020. But direct plan investors are also catching up. The share of SIPs held for over five years in direct plans rose from 4% to 19%, and those held for less than a year dropped from 49% to 30%.
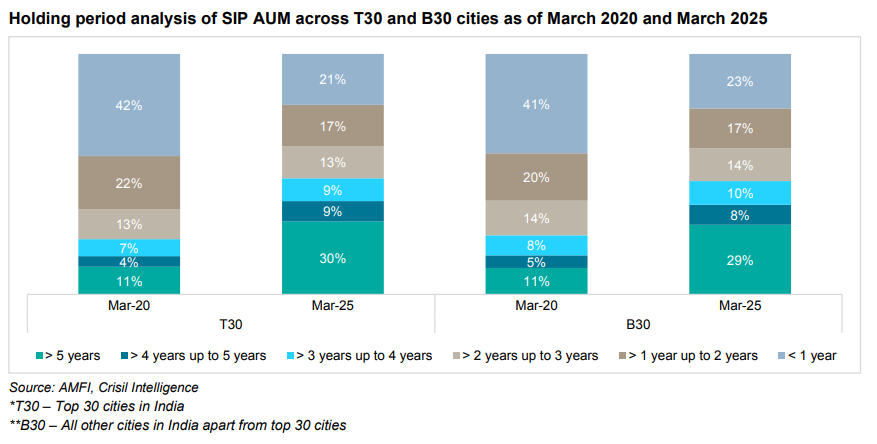
There’s also this long-term shift across geographies. Whether in the top 30 cities or smaller towns beyond them, the holding period trend is nearly identical. SIPs held for more than five years jumped from around 4–5% in 2020 to nearly 30% in 2025. Meanwhile, short-term SIPs, those held for less than a year, have dropped from over 40% to just around 21–23%.
Before we wrap up, here’s a quick question:
And that’s your roundup for mutual fund trends midway through 2025. Thank you for reading; do let us know your feedback in the comments.