
Is China Dumping US Treasury Bonds? Panic in the Treasury Market Explained


Our goal with The Daily Brief is to simplify the biggest stories in the Indian markets and help you understand what they mean. We won’t just tell you what happened, but why and how too. We do this show in both formats: video and audio. This piece curates the stories that we talk about.
You can listen to the podcast on Spotify, Apple Podcasts, or wherever you get your podcasts and watch the videos on YouTube. You can also watch The Daily Brief in Hindi.
In today’s edition of The Daily Brief:
The Tariff Shock That Shook the World's Safest Market
RBI Cuts Interest Rates Again
The Tariff Shock That Shook the World's Safest Market
Today we're diving into what's happening in the US Treasury market – basically the backbone of the global financial system. Over the past week, we've seen some seriously wild moves that have financial experts worried, and I'm going to explain why this matters to everyone, not just Wall Street types.
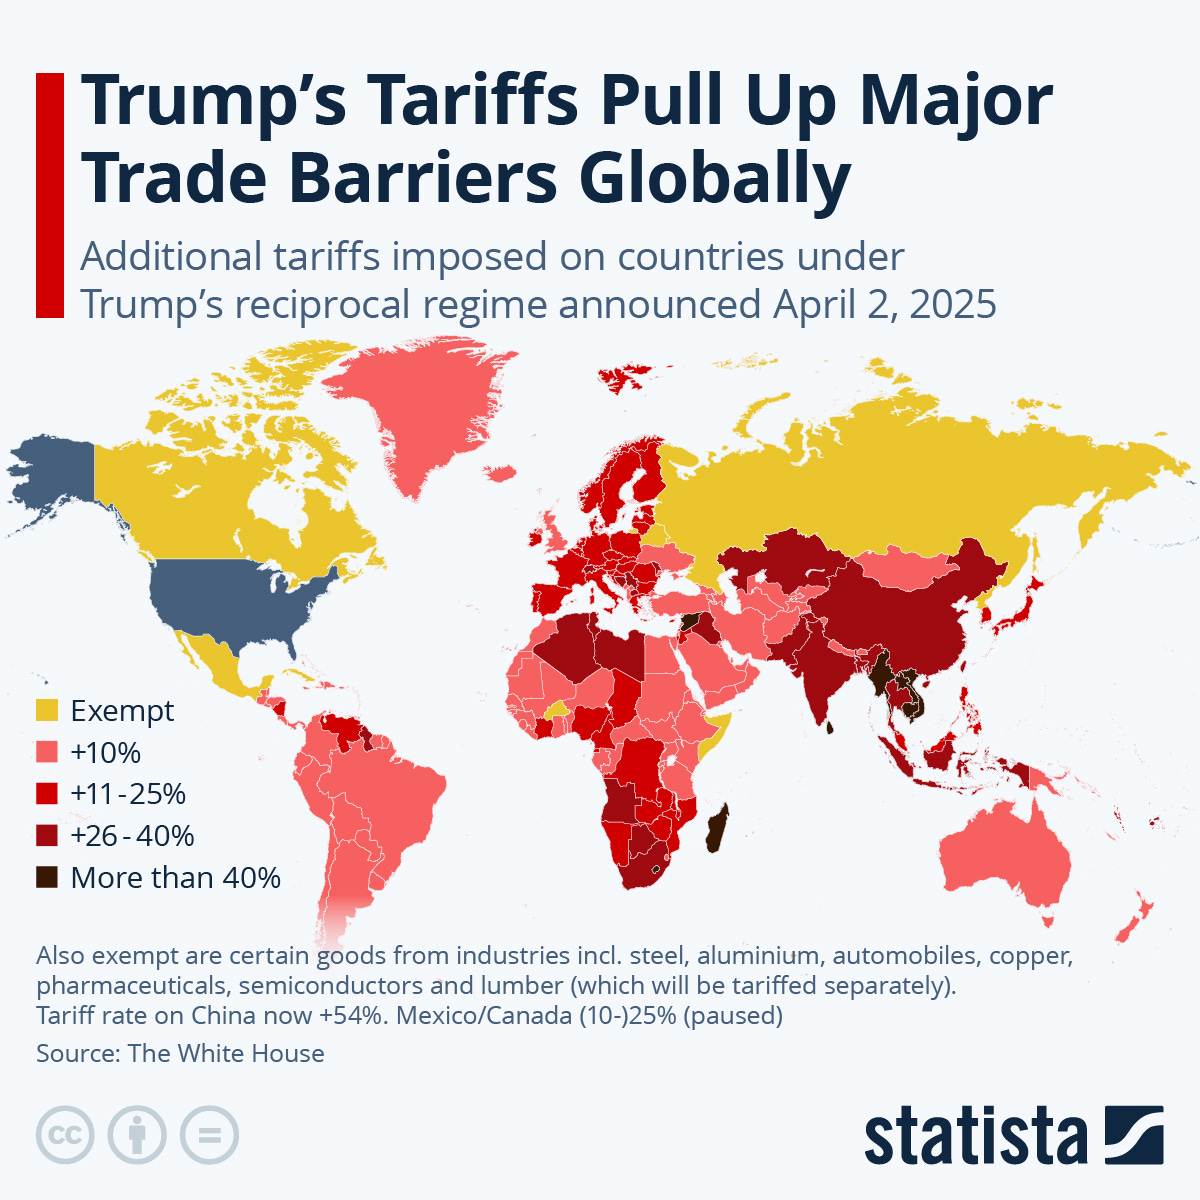
Let's start with what sparked this whole mess – on April 2nd, 2025, just a week ago, President Trump announced what he called "Liberation Day" tariffs. Here's what happened: he slapped a universal 10% tariff on almost everything coming into the US, effective April 5th. But that was just the beginning.
Starting April 9th – that's literally yesterday – he implemented what he called "reciprocal tariffs" on 86 specific countries. The biggest headline-grabber? China got hit with a massive 104% total tariff – combining a new 34% tariff with the 20% that was already in place. India got hit with 26%, the EU with 20%, and countries like Vietnam and Cambodia are facing tariffs as high as 46% and 49%.
This is a seismic shift in global trade policy – Trump basically threw a grenade into the international trading system. At first, markets reacted exactly as you'd expect – investors got nervous about economic uncertainty and rushed to safety, which initially meant buying US Treasury bonds, the traditional safe haven during market stress. When investors flock to safety, they buy bonds, pushing prices up and yields down – that's how the bond market works.
Treasury market movements
But then something strange happened. Instead of Treasury yields staying low, they suddenly spiked dramatically higher – we saw one of the wildest trading swings for 10-year yields in two decades.

Looking at the data, the 10-year Treasury yield, which had dropped to around 4.04% right after the tariff announcement, shot up to 4.40% by yesterday. The 30-year yield jumped even more dramatically from about 4.45% to nearly 4.9%.
To put this in context, since September 2024, the Federal Reserve has cut interest rates by a full percentage point, from 5.25% down to 4.25%. Normally, you'd expect Treasury yields to move in the same direction as Fed rates. But instead, we've seen the 10-year yield climb about 0.6 percentage points, and the 30-year climb 0.76 percentage points over that same period.
That's like driving north while your GPS is telling you you're heading south – it doesn't make sense to most people, and it's got Wall Street scratching its head.
Why the treasury market matters
Now, why should you care about government bonds? Here's the deal – the US Treasury market is the bedrock of the entire global financial system. At over $29 trillion, it's the largest and most liquid bond market in the world.

When it gets jittery, the tremors are felt everywhere – from mortgage rates in America to borrowing costs in countries like India. The Treasury market dysfunction directly impacts India through multiple channels.
First, there's a direct bond yield co-movement. When US Treasury yields rise sharply, Indian government bond yields often follow suit. Second, it affects capital flows – as US yields rise, foreign investors are less interested in Indian debt because the spread between US and Indian bond yields narrows, making Indian investments less attractive when you factor in currency risk.
The rupee also faces pressure as Treasury volatility typically strengthens the dollar during "flight to safety" episodes. Last year, the rupee breached the 85 per dollar mark after Fed policy shifts.

And if Treasury market dysfunction signals broader US economic problems, that affects India's export sector, since the US is one of India's largest export markets.
Is China dumping treasuries?
Now, there's been a lot of chatter that the reason Treasury yields are spiking is because China is retaliating against these tariffs by dumping its US Treasury holdings. It's a tempting narrative – China owns around $760 billion in US government debt, making it the second-largest foreign holder after Japan.

But here's the thing – there's simply no data to support this assertion. The most recent Treasury data we have is from January, and those monthly reports come with a significant lag. So anyone claiming to know what China is doing right now is speculating.
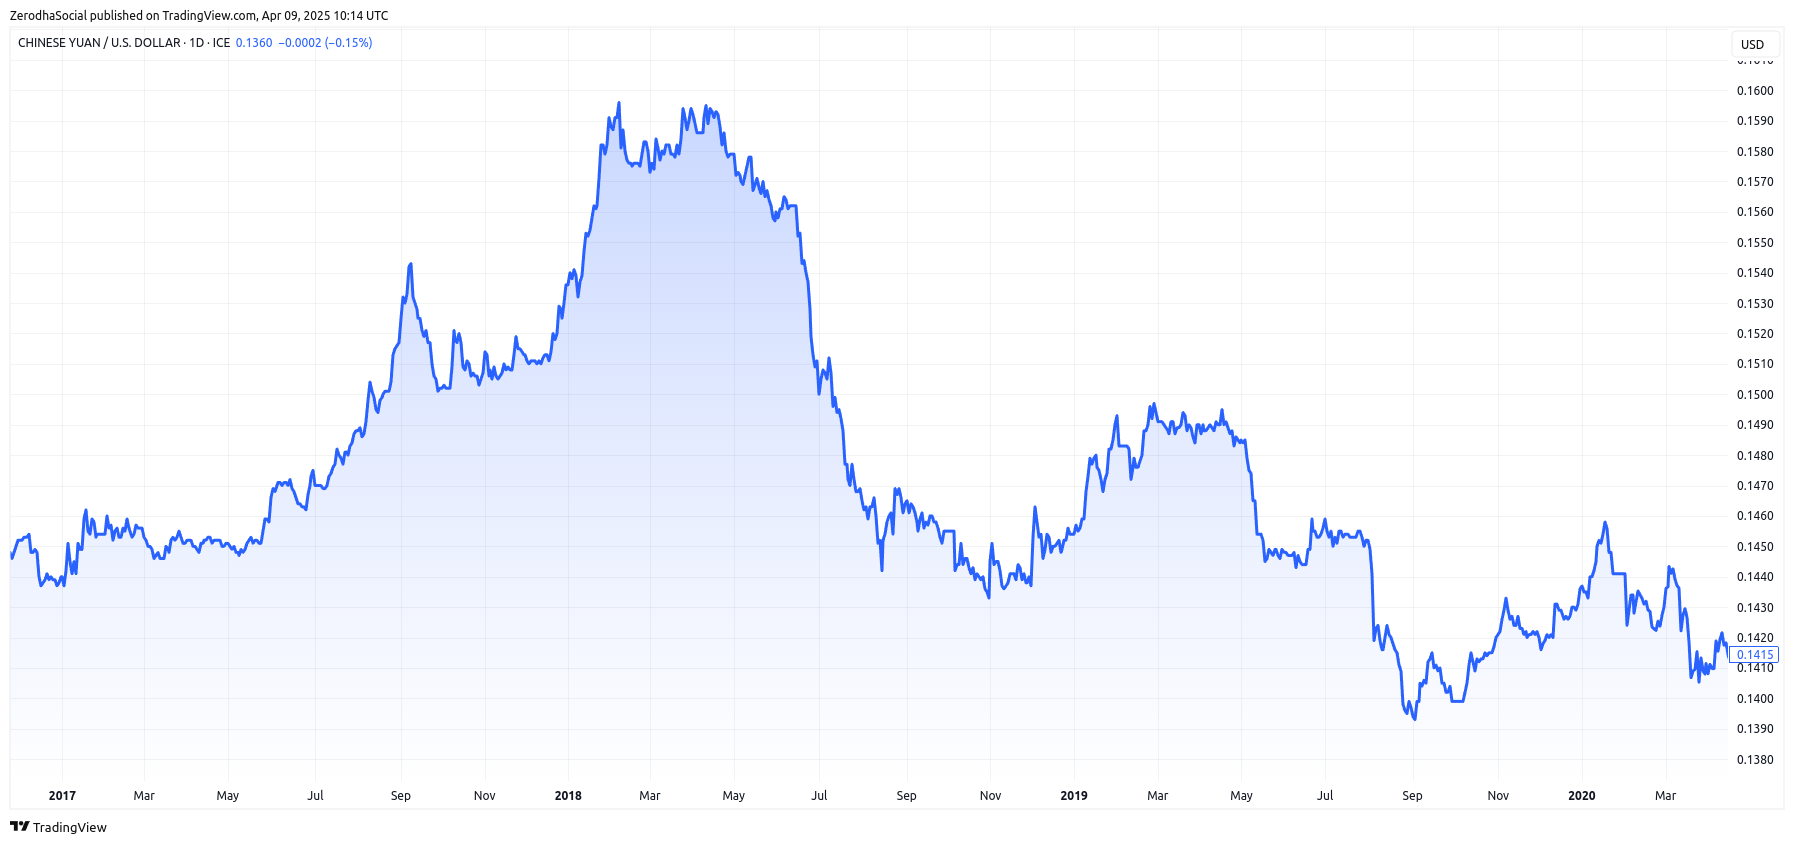
More importantly, history suggests China doesn't use its Treasury holdings as a weapon. During the 2018-2019 trade war, China responded primarily through currency depreciation rather than Treasury sales, allowing the yuan to drop more than 10% to offset the impact of US tariffs.
And there's a simple reason for this restraint, as economist Michael Pettis at Carnegie has pointed out – dumping Treasuries would hurt China as much as it would hurt the US. If China rapidly sold its Treasury holdings, it would depress prices of its remaining holdings, essentially causing China to lose money on its own investments. As Pettis explains, "If China starts selling off its holdings, it would be costly for Beijing."
The hidden treasury holdings
There's another crucial point that most commentators miss – the official figures of China's Treasury holdings don't tell the full story. Although popular charts show China's holdings have decreased from a peak of about $1.3 trillion in 2013 to around $760 billion today, this is misleading.

China has gotten creative with how it holds its dollar assets. Financial experts have identified significant increases in Treasury holdings by Belgium and Luxembourg that suspiciously correlate with decreases in China's direct holdings.
This is because China uses international custodial services like Euroclear in Belgium and Clearstream in Luxembourg to hold Treasuries. Brad Setser, a senior fellow at the Council on Foreign Relations and former Treasury official, points out that when you adjust for Belgium's holdings through Euroclear, China has likely sold a lot less Treasuries than the much larger figures suggested by the official data and press.
In a recent tweet, Brad Setser pointed out that China stopped being a net buyer of US dollar assets about 10 years ago, but at the same time, that doesn’t mean China has sold a whole lot.

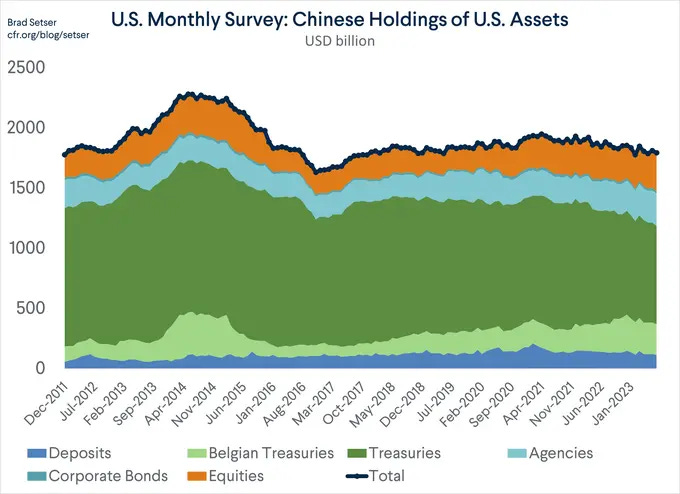
As Setser explains in his analysis, "Adding the Belgian (Euroclear) custodial account to the Treasuries that China still holds with U.S. custodians" gives a much more accurate picture. The missing Treasuries from China's balance sheet in 2013-2014 showed up under Belgium, and then Belgium's holdings fell sharply in 2015-2016 in parallel with China's reserve drawdowns.

It's like if I asked my friend to hold my wallet – just because it's not in my pocket doesn't mean I don't own it anymore.
China also maintains a sophisticated "shadow reserve" system. Economists estimate China sits on about $6 trillion in foreign exchange assets, about half of which is "hidden" from official reporting on the balance sheets of state commercial lenders and policy banks rather than the central bank's official reserves.
Additionally, China has diversified its dollar portfolio beyond Treasuries into US Agency bonds and mortgage-backed securities, which now approach $300 billion. So when people point to declining Treasury holdings as evidence of China reducing its dollar exposure, they're missing the bigger picture.
Why weaponizing the dollar is hard for China
Let's say China did want to use its Treasury holdings as economic leverage. There are really only a few ways they could reduce their purchases of US government bonds acording to Michael Pettis:
One, they could buy fewer US government bonds but more other US assets – which would change absolutely nothing for either country.
Two, they could buy fewer US assets overall, but other Chinese entities could buy more to keep net flows unchanged – again, no real impact.
Three, they could redirect their purchases to developed countries like the EU or Japan. But these economies don't want massive Chinese inflows either, as it would strengthen their currencies and hurt their exports. And if they redirected the flows back to the US, we're back to square one.
Four, they could buy assets from developing countries instead, which would benefit global growth but carries high investment risks for China.

Or five, they could simply reduce their overall foreign investments, which would mean either reducing domestic savings or increasing domestic investment. This would force China to run lower trade surpluses, potentially causing unemployment to rise or debt to increase.
In almost every scenario, China either sees no benefit or actively harms itself more than it harms the US. It's like threatening to punch someone while your arm is tied to theirs – you're going to feel that punch too.
The real reason for treasury volatility
So if China isn't dumping Treasuries, what's actually driving this bond market turmoil? Several factors are at play.
First, a disappointing Treasury auction is adding fuel to the fire. On Tuesday, a $58 billion auction of three-year Treasury notes attracted the weakest demand since 2023, with dealers forced to absorb 20.7% of the offering – the highest percentage since December 2023 according to the Financial Times.
Second, Robin Wigglesworth of Financial Times reported that there's the possible unwinding of the "basis trade" – a leveraged strategy employed by hedge funds that Apollo's chief economist Torsten Slok estimates has grown to approximately $800 billion in size. This involves exploiting tiny price differences between Treasury securities and Treasury futures contracts, using extreme leverage (sometimes up to 100x) to amplify returns. When market conditions change rapidly, as they did with the tariff announcements, these highly leveraged positions need to be liquidated quickly, creating a self-reinforcing cycle of selling pressure.
Then there's the Treasury-swap spread trade. Banks are constrained by regulations in how many Treasuries they can hold, while cleared interest rate swaps require less capital. Earlier this year, hedge funds bet that the Trump administration would loosen these regulations, allowing banks to hold more Treasuries. They went long Treasuries and short swaps, expecting the spread between them to narrow.
But with the trade war escalating, banks started selling Treasuries to raise cash while adding swaps contracts to maintain exposure to interest rates. This caused swap rates to plunge far below Treasury yields, forcing leveraged traders to unwind their positions and amplifying the Treasury sell-off. As the Financial Times reported, "It's a proper, full-on hedge fund deleveraging," according to one trader at a Wall Street bank.
These technical factors are combining with fundamental concerns about inflation from tariffs and potential increases in government borrowing to finance tax cuts.
The covid “dash for cash” parallel
We've seen this movie before, and it didn't have a happy ending. In March 2020, at the onset of the COVID pandemic, the Treasury market experienced what's now known as the "dash for cash" – a period of extraordinary disruption that required unprecedented intervention by the Federal Reserve.

During that crisis, investors worldwide rapidly sold assets to raise cash. Treasury prices fell precipitously instead of rising (which is what usually happens during market stress), and market depth collapsed. Mutual funds sold approximately $200 billion in Treasuries in the first quarter of 2020 alone, while hedge funds reduced positions as volatility and margins increased dramatically.
The severity of the dysfunction forced the Fed to implement extraordinary measures, including expanding repo operations and purchasing approximately $1.6 trillion in Treasury securities between March and June 2020.
Today's situation shares some troubling similarities with that episode. Reuters reports that investors and analysts say the current move is "reminiscent of the dash-for-cash at the onset of the COVID-19 pandemic in March 2020, when the market seized up as fears about the coronavirus grew." Both episodes feature liquidity-driven selling pressure, declining collateral values forcing deleveraging, and the unwinding of leveraged Treasury trades.
But there are important differences too. In 2020, we had pandemic-induced fear driving a global dash for cash. Today, we're seeing a geopolitical shock from tariffs combined with structural leverage in specific trading strategies. The 2020 crisis occurred with Fed rates near zero, while today rates are at 4.25%. And perhaps most critically, in 2020 deflation fears dominated, while today tariffs are seen as inflationary.
Conclusion
So where does this leave us? The Treasury market is showing clear signs of stress, with some analysts even suggesting the Federal Reserve might need to step in with an emergency rate cut if conditions worsen further. But unlike 2020, the Fed might be reluctant to bail out mega-leveraged Treasury arbitrage trades, especially since these traders were positioned foolishly ahead of a predictable tariff shock.
What's clear is that we're witnessing more than just a simple market reaction to tariffs. This Treasury market turmoil reveals structural vulnerabilities in what's considered the world's safest market, challenges traditional assumptions about Treasury securities as a safe haven, and raises questions about future market stability.
If this volatility persists, it could have far-reaching implications for mortgage rates, corporate borrowing costs, and overall financial conditions globally – potentially compounding the economic impact of the tariffs themselves. And countries like India that are integrated into the global financial system will feel these effects as capital flows shift, currencies adjust, and export markets evolve.
RBI Cuts Interest Rates Again
The Reserve Bank of India's Monetary Policy Committee (MPC) wrapped up its latest meeting on April 9, 2025, with a big announcement: they've unanimously decided to cut the repo rate by 25 basis points, bringing it down from 6.25% to 6.00%.
This is the second straight rate cut this year. At the start of 2025, the repo rate was 6.5%—so in total, we’re down 50 basis points already.
They’ve also shifted their stance from neutral to accommodative, which is a fancy way of saying: “Inflation looks under control, so let’s now focus more on boosting growth.”
This comes at a time when China has raised tariffs on US goods to 84%. But let’s park that drama for another day.

So what does this mean in simple terms?
It means the RBI is feeling confident about keeping inflation in check, and wants to help push the economy forward, especially now that growth is looking a little slow.
Why did the MPC cut the Repo Rate?
To understand their rationale, let's delve a bit deeper.
What’s Happening with Inflation?
Inflation has cooled off quite a bit over the past few months, and that’s a big reason why the RBI felt comfortable cutting rates again. Headline consumer price inflation, which was as high as 6.2% in October 2024, dropped sharply to 3.6% in February 2025—a seven-month low. This sharp fall was led mainly by a steep drop in food prices.
Food inflation, which averaged around 8.5% between October and December 2024, fell to just 3.8% by February. This decline is largely thanks to a great harvest—wheat and pulses production hit record highs—and vegetable prices came down after a big spike last year.
Fuel inflation also played a part. It remained in deflation territory throughout this period, meaning fuel prices were actually falling year-on-year. But even here, things are cooling off less sharply. Fuel inflation was down -12.8% in July 2024, but the pace of deflation slowed to -1.3% by February 2025. That means fuel prices are still lower than they were a year ago, but the gap is narrowing.
At the same time, core inflation—which strips out food and fuel—has been a bit more sticky. It rose from an average of 3.3% in the first half of FY25 to about 3.8% in the second half. Still, it's below the 6%-plus levels we were seeing a year ago, so the RBI isn’t sweating over it yet.
Also worth noting: consumer inflation expectations have started to drop. According to the RBI’s March 2025 survey, urban households now expect inflation to be lesser than what they expected back in January for the coming months.
Based on all this, the RBI believes inflation will stay close to its 4% target for the rest of the year. Of course, they’re still keeping an eye out for risks—like a bad monsoon or a spike in global commodity prices—which could shake things up again.

What about growth?
India’s economy grew at a strong 9.2% in 2023-24, but that momentum didn’t last. Growth for 2024-25 is expected to come in at 6.5%, and for the upcoming year—2025-26—the RBI has lowered its projection from 6.7% to 6.5%.
The reasons are mostly global. Trade tensions are rising, tariffs are going up, and markets are jittery. Stock markets have been volatile, bond yields have been sliding, and the US dollar has weakened—factors that make it harder for countries like India to maintain a strong export and investment cycle.
Even so, there are some encouraging signs.
In the third quarter of FY25 (October–December), GDP growth picked up to 6.2% from 5.4% in the previous quarter. This was mainly due to better performance in agriculture and services. Also, consumer confidence is improving. In March 2025, the RBI’s survey showed the current situation index rose to 95.5, and the future expectations index jumped to 122.4. So while people are still cautious, there’s a growing sense that things could start looking up.
The RBI’s quarterly forecast for FY26 growth averages around 6.5% for the year. But again, these numbers come with a warning. The RBI has done stress tests to see what could go wrong. For example, if crude oil prices rise 10%, inflation could rise by 30 basis points, and growth could slow by 15bps. If the rupee weakens by 5%, inflation could rise 35 basis points—but interestingly, growth might actually improve slightly due to more competitive exports. Bottom line: things are still fragile.
Great, but what does this mean for you?
A repo rate cut typically means borrowing becomes cheaper. In theory, lower interest rates encourage people and businesses to borrow and spend more, stimulating economic activity.
But here's the catch: cutting rates works well when people feel good about spending. Right now, that's not exactly the situation.
As we've discussed in earlier stories, employment numbers aren't great, salaries aren't rising quickly, and consumer confidence remains shaky. When people feel uncertain about their future income, they're naturally hesitant to spend or borrow more, no matter how attractive the loan rates might seem.
So, looking at this rate cut in isolation and calling this inflationary would be a wrong way to look at it, and when the current economic situation is also factored in we realize that there are a lot of other macro factors that might negate the effect of the rate cut for the economy.
Which brings us neatly to a question one of our regular readers asked us on Twitter:

“Does your home loan rate go down by 0.25% as soon as the RBI repo rate is cut? Do you get the full benefit passed on?”
Short answer? Yes—but not instantly.
Like most things in finance (and life), it’s just a little more complicated than that. So bear with us while we break it down quickly.
When banks give out loans to people like you and me, they decide the interest rate based on three things:
A reference rate (kind of like the base rate),
A spread (their profit margin), and
A risk premium (how risky they think you are).
Now, this interest rate can be fixed or floating—we’ll focus on floating, since that’s where the RBI’s repo rate comes into play.
Before October 1, 2019, most floating-rate loans were linked to something called the MCLR (Marginal Cost of Funds-based Lending Rate). This was based on the cost at which banks raised money—from depositors, bonds, etc.
But here’s the problem: MCLR was an internal benchmark, and it didn’t respond well (or quickly) to repo rate changes. So even if RBI cut the repo rate, your EMIs didn’t budge for months. There was also very little transparency on how MCLR was calculated.
The RBI didn’t love this delay. So, it made a rule:
From October 1, 2019, all new floating-rate retail loans (like housing or auto loans) must be linked to an external benchmark (ELBR).
Banks can choose from a few options:
RBI’s policy repo rate (most common)
3-month or 6-month Government of India Treasury Bill yields
Any other benchmark market rate
(And no matter which benchmark is chosen, they all move in tandem with repo rate changes.)
The interest rate you pay is then calculated as:
ELBR = External Benchmark (like Repo) + Spread (margin + risk premium)
This ELBR is typically reset every 1 to 3 months, depending on your loan agreement.
Now, we couldn’t find the latest data, but here are some interesting insights on the breakup of MCLR vs ELBR loans in the Indian banking system as per CareEdge Ratings.
As of September 2024, about 60% of all floating-rate loans given by banks are now linked to external benchmarks like the repo rate or government treasury bill rates. That’s up from 56% in December 2023.
Meanwhile, loans linked to the older MCLR system have come down to 36% by December 2024 (from 39% in December 2023).
There’s more nuance when we look at the data comparing private banks with public banks. Private banks (PVBs) have adopted the new system way more than public sector banks (PSBs).

By December 2024, 86% of floating loans in private banks were linked to external benchmarks, compared to only 45% in public banks.
What does that mean?
If you’re a customer of a private bank, you are more likely to see your loan interest rates fall faster after an RBI rate cut than if you were a customer of a public sector bank.
Why? Because these loans respond quickly to changes in the repo rate. So, with the latest rate cut, borrowers in private banks might see lower EMIs sooner than those in public banks.
So… will your home loan interest rate go down immediately? Yes—but not overnight.
When the RBI cuts rates, your loan interest rate will go down, but only when your next reset date comes around. That could be anywhere between 30 to 90 days from the repo rate cut.
So while the repo rate cut helps, don’t expect your EMI to drop the next morning. It’s much faster than the old MCLR-based system, but still not instant.
Tidbits:
Tata Motors Group reported a 3% year-on-year decline in global wholesales for Q4 FY25, with total volumes standing at 366,177 units. Commercial vehicle sales, including Tata Daewoo, dropped 3% to 107,765 units, while passenger vehicle volumes, including EVs, fell 6% to 146,999 units. Jaguar Land Rover (JLR) offered slight relief with a 1% uptick in wholesales at 111,413 units, led by Land Rover’s 104,343 units and Jaguar’s 7,070 units. However, retail sales for JLR declined 5.1% to 108,232 units, suggesting weaker consumer demand. Regionally, JLR’s North American sales rose 14.4%, while China plummeted 29.4%, Europe dipped 10.9%, and the UK remained nearly flat at 0.8%. Overall, the decline in Tata’s core PV and CV segments offset JLR’s gains, raising concerns over growth sustainability and future demand visibility.
Prices of the upcoming iPhone 16 Pro in the US could rise by 30%, pushing the cost of a $1,000 phone to $1,300, as the US considers increasing import tariffs. Analysts expect the hike due to a proposed 54% duty on China and 26% on India, the two key iPhone manufacturing hubs. If the US implements an additional 50% levy, total tariffs could touch 104%, spiking the iPhone’s price to $1,500–$1,600. Apple might absorb part of the increase, but with stockpiled inventory expected to run out in a few months, price adjustments could be inevitable. Brazil, with a 10% duty, is not a viable alternative due to limited capacity.
In a major boost to its electronics ambitions, the Indian government has notified a ₹22,919 crore Production-Linked Incentive (PLI) scheme to promote domestic manufacturing of critical components like lithium-ion cells, multilayer PCBs, display and camera modules. The scheme, set to be rolled out in 2–3 weeks, will run for 6 years with optional 1-year gestation and offer incentives based on turnover and capital expenditure. Over 400 production units already operate in this space, and with smartphone exports crossing ₹2 trillion in FY25—₹1.5 trillion from Apple alone—India aims to shift from assembling gadgets to manufacturing their core parts.
- This edition of the newsletter was written by Bhuvan and Kashish
📚Join our book club
We've recently started a book club where we meet each week in Bangalore to read and talk about books we find fascinating.
If you'd like to join us, we'd love to have you along! Join in here.
🌱Have you checked out One Thing We Learned?
It's a new side-project by our writing team, and even if we say so ourselves, it's fascinating in a weird but wonderful way. Every day, we chase a random fascination of ours and write about it. That's all. It's chaotic, it's unpolished - but it's honest.
So far, we've written about everything from India's state capacity to bathroom singing to protein, to Russian Gulags, to whether AI will kill us all. Check it out if you're looking for a fascinating new rabbit hole to go down!
Subscribe to Aftermarket Report, a newsletter where we do a quick daily wrap-up of what happened in the markets—both in India and globally.
Thank you for reading. Do share this with your friends and make them as smart as you are 😉
Thanks for sharing this. 💡
Hi - Excellent read as always. One question - The chart for global bond market shows US debt outstanding at $50 trillion, but it is mentioned above that the size of US treasuries is ~$30 trillion. What's the difference? Thanks.