

Welcome to Beyond The Charts. A series where we look at charts to make sense of what’s happening in finance and the economy and uncover the stories they tell.
In this edition, we take a look at Goldman Sachs’ report named “Investing in Everything, Everywhere, All at Once.” The report explores how the world’s entire stock of investable assets—what Goldman calls the World Portfolio—has grown, changed, and concentrated over time, revealing how financial markets today have come to dwarf the real economy.
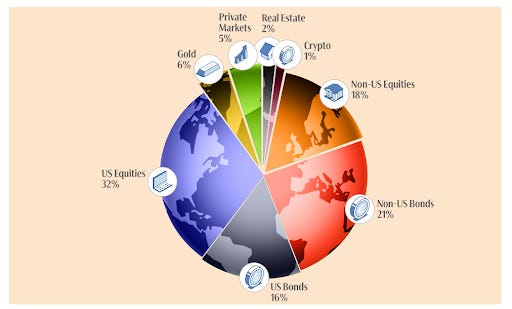
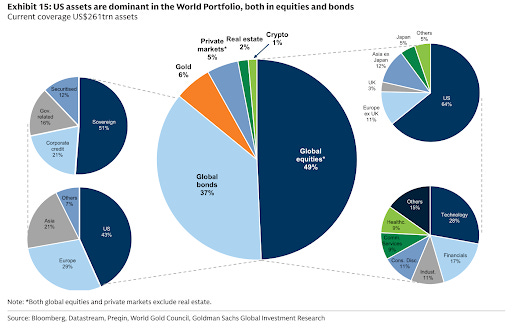
The world portfolio is essentially the sum of all investable assets around the world; the list includes global equities, bonds, gold, and alternative assets.
And let’s start with the big number: The report estimates the total value of these assets at about $261 trillion.
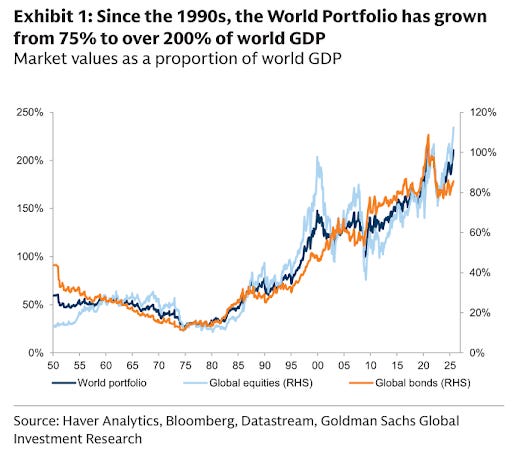
This is a little more than twice the size of global GDP, compared with about 75% of global GDP in the early 1990s. The increase reflects long-term asset returns as well as the expansion of global capital markets.
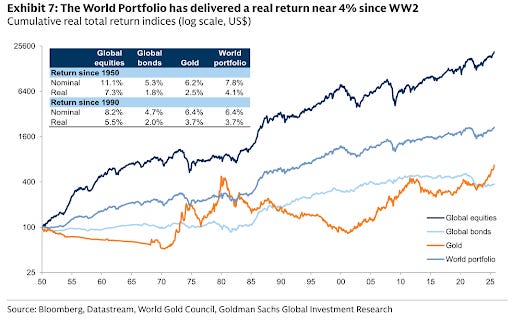
A big part of it is simple math. Over the past 75 years, a global mix of stocks, bonds, and gold has returned about 7.8% a year before inflation and just over 4% after inflation. That may not sound like much, but over 75 years, that compounds massively.
Another reason is how financial markets themselves have changed. Since the 1950s, global markets have grown deeper and more liquid. Companies issued more equity, governments borrowed more, and falling interest rates increased the value of existing bonds. As multinational companies expanded and technology made markets more connected, investors could access a far wider range of assets across countries.
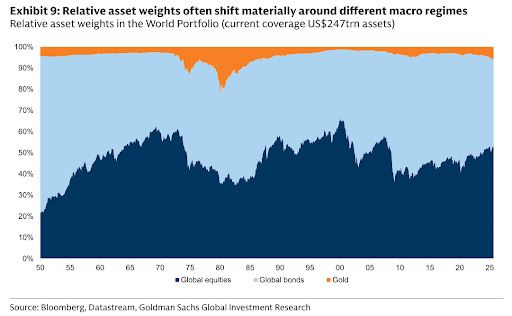
This growth hasn’t been smooth. Different periods have favored different kinds of assets.
In the 1970s, high inflation weakened both stocks and bonds, while gold held up better.
In the 1990s, as inflation eased and global markets opened up, equities—especially technology companies—saw strong gains.
After the 2008 financial crisis, very low interest rates and central bank support boosted the value of both stocks and bonds, increasing the overall size of financial markets.
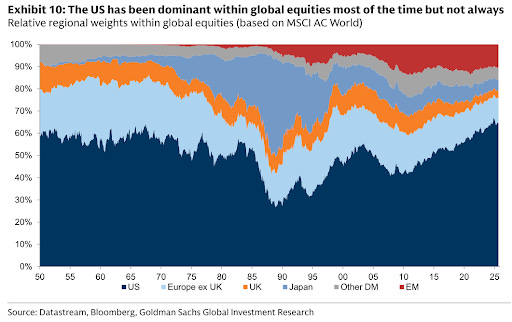
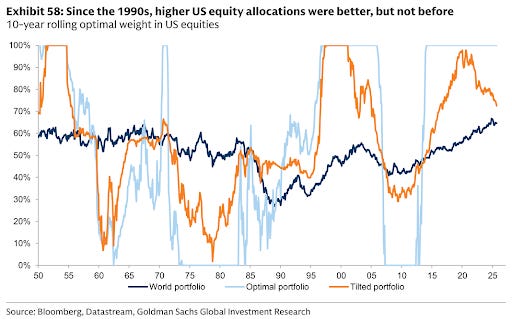
One of the biggest shifts in the world portfolio is the increasing weight of the United States. Since the 1950s, U.S. equities have made up roughly half of the global equity market, and that share has grown over time. Today, the U.S. represents about 60 to 65 percent of global equity value, far ahead of any other single market.
Why has the U.S. become so dominant?
One reason is the outperformance of U.S. markets and companies. Since the 2008 financial crisis, the U.S. equity market has delivered stronger returns than most other regions. U.S. companies have reported higher and more stable profitability, supported in part by the expansion of large technology firms, lower financing costs, and relatively moderate wage growth over the period. These factors raised earnings and valuations, increasing the weight of U.S. equities in global benchmarks.
Sector composition also played a role. The U.S. has a larger concentration of technology and communication services companies, which performed well over the past decade. In contrast, regions with higher weights in banks, energy, or industrial sectors saw comparatively weaker returns, widening the gap between U.S. and non-U.S. markets.
Global investor behavior has contributed as well. U.S. assets benefit from the depth and liquidity of American capital markets and the reserve-currency status of the U.S. dollar, leading many international investors to treat them as a reliable long-term holding. As global benchmarks became more U.S.-heavy, overseas allocations tended to follow.
Though it’s worth noting that U.S. dominance has ebbed and flowed historically. For example, U.S. stocks also outshone others in the 1990s, whereas the 2000s saw some catch-up by emerging markets. The current era, however, shows an extraordinary American lead.
Along with regional shifts, the sector composition of global markets has also changed over time. Technology and Financials now make up a significant share of global market capitalization, while sectors linked to commodities account for a smaller portion than in earlier decades.
In previous periods, global indices had larger weights in energy, materials, and industrial companies involved in oil, mining, and manufacturing. As economies shifted toward services and knowledge-based industries, the composition of listed companies also changed.
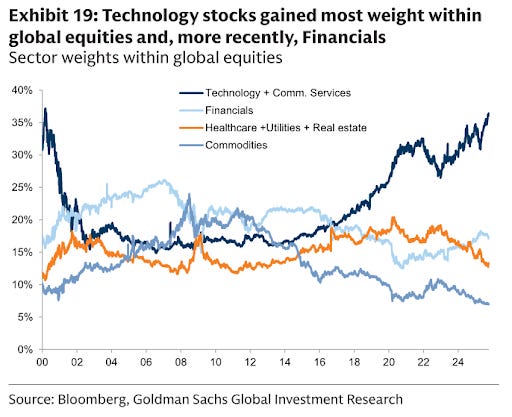
Technology firms across software, internet services, hardware, and electronics, along with financial institutions such as banks, insurers, and payment companies, now represent a substantial part of global equity value. Goldman’s exhibits show these two sectors collectively outweighing commodity-linked sectors, which have declined as a share of total market capitalization.
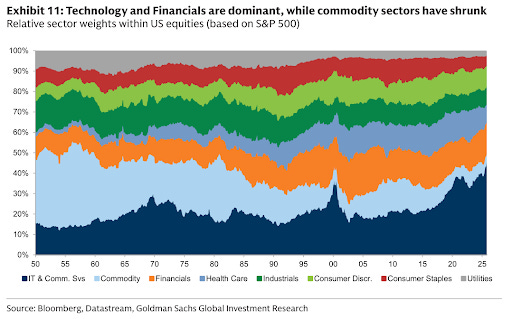
Historical events have also influenced sector weights. For example, the Financial sector lost ground after the 2008 Global Financial Crisis (GFC) and has not regained its pre-crisis stature. Before 2007, banks and other financial firms accounted for a much larger portion of global indices, but the crisis led to a significant and lasting reduction in their valuations.
In the years that followed, the Technology sector increased its share. Large U.S. technology companies—such as Apple, Microsoft, Google, and Amazon—expanded substantially and became some of the largest constituents of global equity markets, surpassing the size of major financial institutions and energy companies.
These sector changes also appear in investor allocations. Global investors have gradually increased their equity exposure, and overall equity weights are now close to levels last seen in the late 1990s.
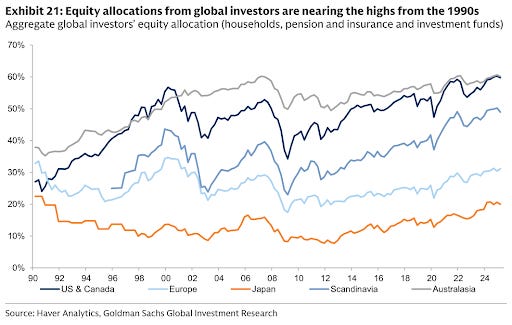
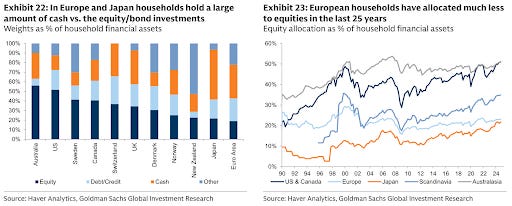
That said, allocation preferences vary by region. Europe’s financial system is more bank-centred and less integrated than the U.S., and this structure has contributed to European investors holding lower equity allocations. In markets where capital markets are smaller or where households rely more on bank deposits, participation in equities has historically been lower as well.
Another behavioral trend is the influence of benchmarks on investor decisions.
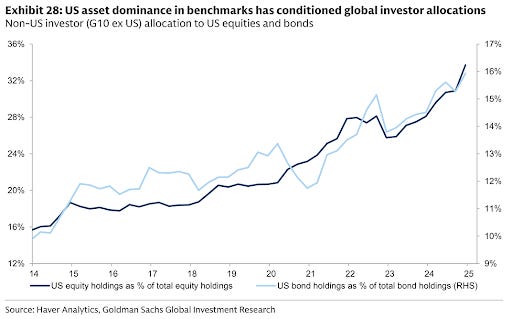
As global indices have become more weighted toward U.S. assets, investors who track these benchmarks have increased their allocations to U.S. equities and bonds. As per the report, investors in G10 countries outside the United States have steadily raised their exposure to U.S. markets, and overseas ownership of U.S. equities is currently at its highest recorded level.
Given these trends, Goldman examines whether simply investing in the world portfolio “as is” is the best strategy. Interestingly, the analysis finds that just matching the global market portfolio has seldom been the optimal portfolio historically.
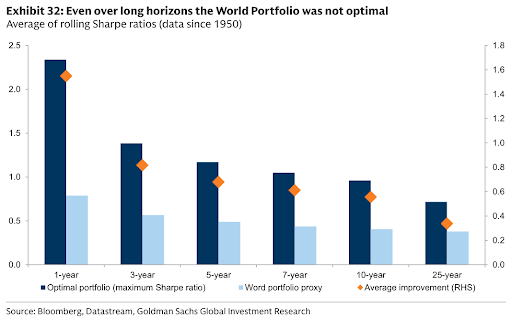
For example, since 1950, a basic 60/40 mix of global equities and global bonds has delivered stronger long-term risk-adjusted returns than the market-cap-weighted World Portfolio.
The report notes that over long horizons, the world portfolio rarely maximizes risk-adjusted returns (Sharpe ratio) compared to other allocations. In fact, the world portfolio often underperformed simpler strategies like 60/40.
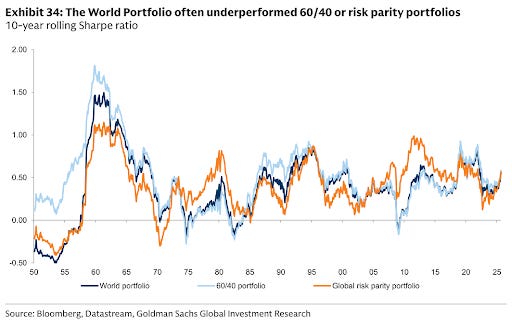
The years after the 2008 financial crisis provide one example. During this period, U.S. equities outperformed most other asset classes, and portfolios with a deliberate overweight to U.S. stocks saw stronger returns than the globally diversified World Portfolio.
In conclusion, the world portfolio helps show how global markets have shifted over the decades—across regions, sectors, and asset classes. Its evolution reflects changes in market structure, economic cycles, and the growing weight of U.S. and technology-related assets.
That’s it for this edition. Thank you for reading. Do let us know your feedback in the comments.
Insightful 💯
Excellent content, data and analysis yet again!