How does one score the RBI?
Our goal with The Daily Brief is to simplify the biggest stories in the Indian markets and help you understand what they mean. We won’t just tell you what happened, but why and how, too. We do this show in both formats: video and audio. This piece curates the stories that we talk about.
You can listen to the podcast on Spotify, Apple Podcasts, or wherever you get your podcasts and watch the videos on YouTube. You can also watch The Daily Brief in Hindi.
In today’s edition of The Daily Brief:
Will the RBI get a new report card?
How China’s economy beat ours: The human capital story
Will the RBI get a new report card?
The Reserve Bank of India has a lot of responsibility on its shoulders. It makes decisions that impact 140+ crore people in almost every aspect of their financial lives. So, it’s only natural that we, both as finance nerds and citizens, ask: how do we know if the RBI is doing a good job?
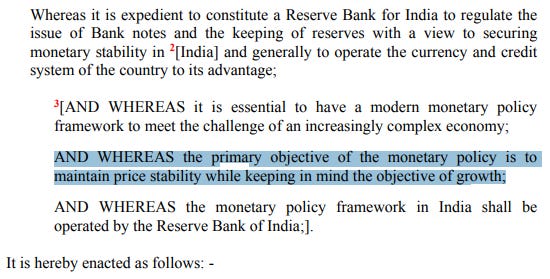
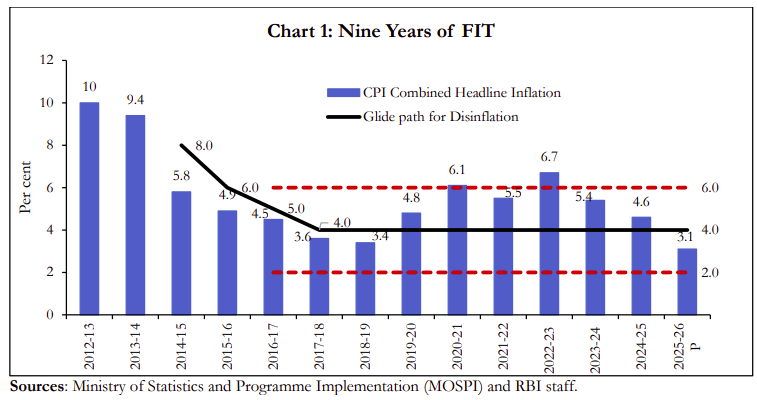
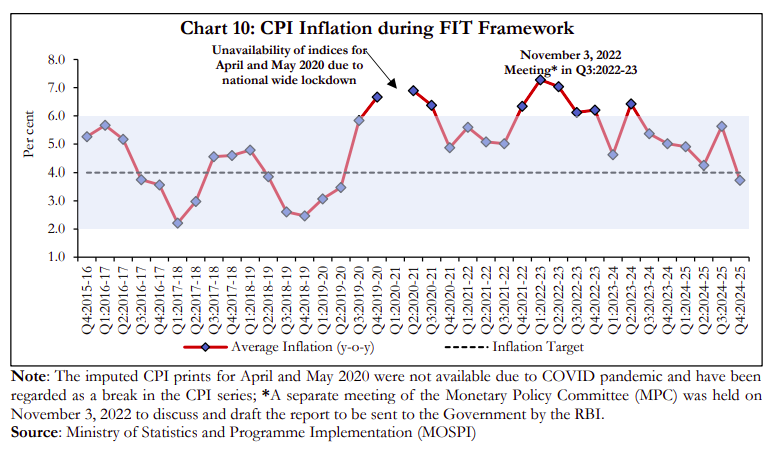
Interestingly, the RBI has something resembling a report card. Back in 2016, Parliament amended the RBI Act to give it a crystal clear mandate: keep prices stable while supporting growth. This was to be measured according to how well it stuck to a target — keeping consumer price inflation (CPI) at 4%, with a tolerance band of 2%.
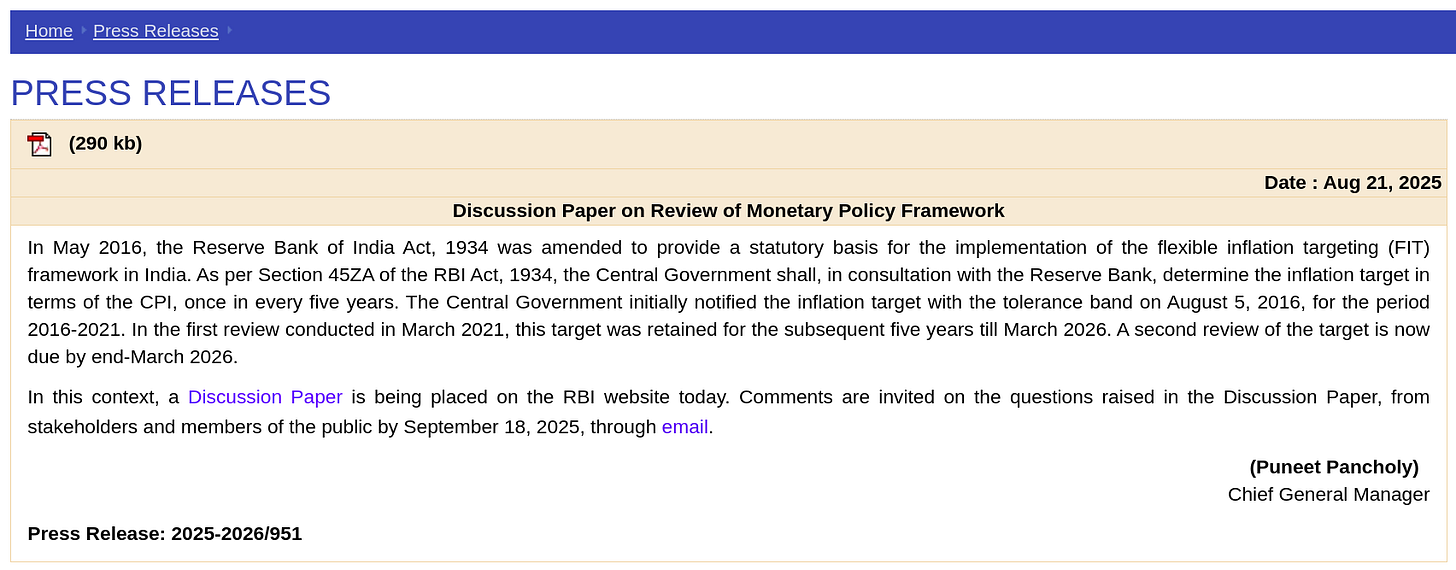
This target is to be reviewed and reset every five years. That has happened once so far, in March 2021, where it was kept steady at 4% ± 2%.
But now, it’s review time again. The RBI just released a Discussion Paper ahead of the March 2026 deadline. In it, the central bank asks fundamental questions on whether this is, after all, the right target to set.
In short, the RBI is opening up a debate on how exactly it should be judged in the years ahead. But that is also, in turn, a fascinating window into its current approach.
The job description
Before we judge the RBI’s performance, let’s go to the basics: what does the RBI actually do?
At its heart, RBI’s primary job is managing the amount of money in our economy. It literally prints the notes in your wallet. But it also makes more arcane decisions — like what is the “cost‘ of money for a bank, or how much money it must park aside before it gives a loan. In doing so, the RBI controls the amount of money moving around the economy. Economists call this “monetary policy” — and it touches almost everything we care about. Here’s a short list:
Prices and wages: If the RBI makes it easier for more money to enter the economy, people spend more — cars, homes, phones, dinner outings etc.. Sometimes, people start spending too much, and prices climb. When prices are higher, workers demand higher wages. That pushes firms to raise prices again — getting into a loop. Tightening money supply, meanwhile, slows this down.
Growth and jobs: Cheaper money lowers EMIs and borrowing costs. Businesses borrow that money to invest more in the economy, often leading to more jobs too. Expensive money flips the script: businesses pull back and focus on survival.
Exchange rate: The RBI’s actions change the price of the rupee on international markets: both by controlling its supply, and by making trades directly. When the Rupee falls in value, imports turn costlier, resulting in higher prices. Higher rates do the reverse.
And so on. The RBI’s actions, in short, affect every single thing in our country that involves money.
This is, naturally, an important job. It’s also a very complicated job, the effects of which are impossible to measure accurately. So your best bet is to find a good set of proxies that the RBI can go after.
That’s why we rely on a simple yardstick — a monetary policy framework — which is a set of rules and targets to judge whether the RBI is doing its job. In India’s case, that yardstick is: don’t let consumer price inflation get either 2% higher or lower than 4%.
Questioning the report card?
Why is inflation the chosen yardstick?
Well, inflation is the most direct thing the RBI can control. Its tools allow it to influence how much money is flowing through the system. The most immediate effect of that is on prices. This makes it a good proxy.
The RBI’s aim is to keep prices broadly stable, while rising just enough that people have to put their money to work. Those are the conditions where businesses invest and jobs grow, while households aren’t constantly worried about tomorrow’s bills. That’s the idea behind ‘Inflation Targeting’.
This isn’t unique to India — 48 countries use this framework. And since we adopted it in 2016, it has worked reasonably well in bringing the inflation down and keeping prices stable — even through shocks like the pandemic.
But what of the specific way in which we do inflation targeting? Why the consumer price index, specifically? Why 4%? Why stick to a 2% band?
Those are the questions at the heart of their discussion paper.
Headline vs Core
Here’s one big question.
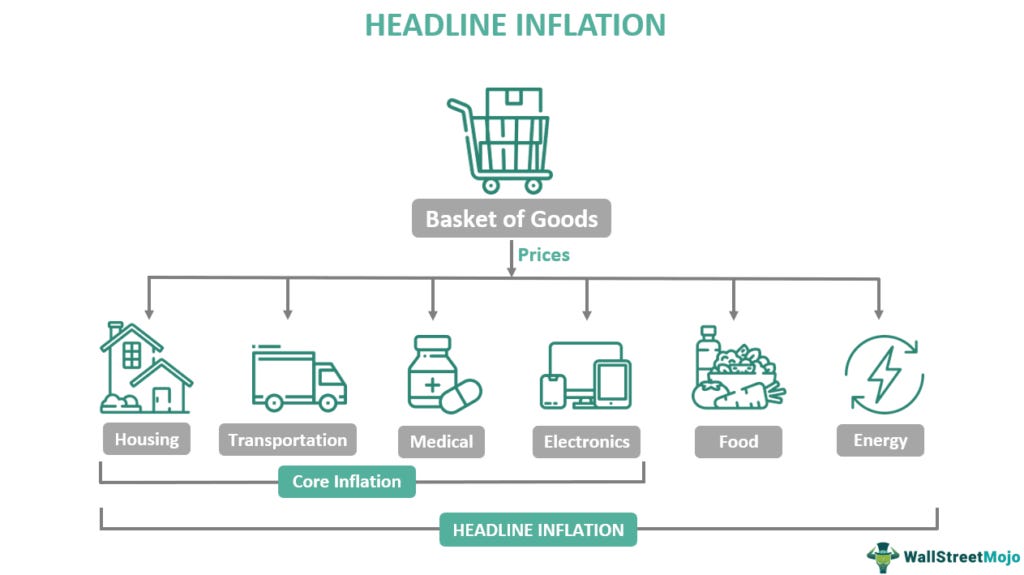
When we say “inflation,” should we talk about headline inflation — the entire basket of goods and services an average household consumes? Or should we look at core inflation, which excludes things like food and fuel — which are often outside the RBI’s control? Right now, we do the former. But the RBI is bringing that into question.
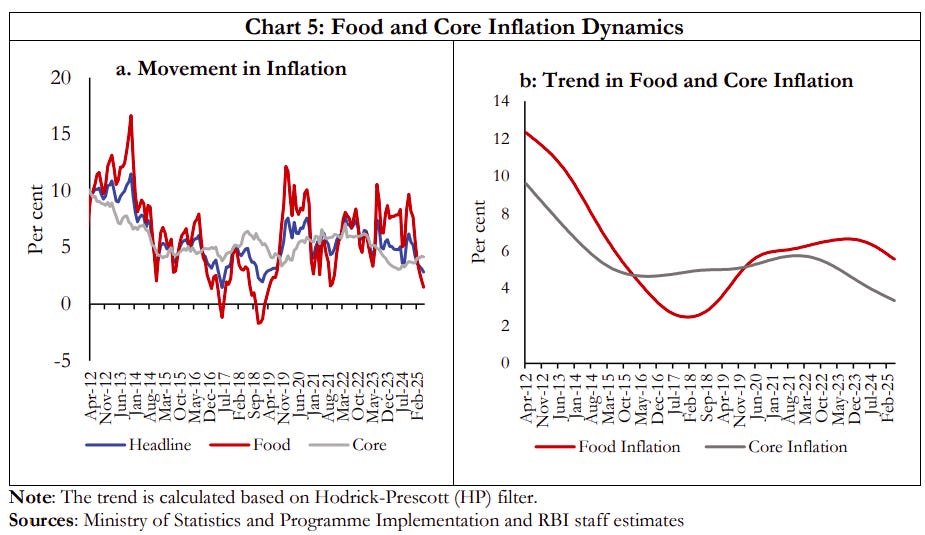
You see, our aim, here, is to look at how money supply affects prices. But food and fuel are extremely noisy. Their prices swing with the monsoon, global oil markets, logistics, and trade decisions. Money supply is just a single, distant factor in what they cost.
If you judge the RBI on a number dominated by weather and geopolitics, do you risk chasing shadows? What if the RBI did an excellent job all year, but the rains were terrible, and food inflation made its performance look terrible?
That’s why, one may argue, you should move to “core” inflation: focus the RBI’s report card on the sticky part of inflation, where prices are otherwise stable, so the impact of monetary policy is a lot more clear. The RBI’s paper supports this side of the debate with data on how volatile food or fuel can be, and how little they respond to its moves.
On the other hand, for the average Indian, food and fuel is inflation. They dominate household budgets. The latest Household Consumption Survey shows that 90% of the poorest rural households, and half of the poorest urban ones, spend more than half their monthly outlay on food and energy.
If you drop food and target core inflation, that could break the link between what the RBI tries to do, and the lives of ordinary people. It could bring two things into question: credibility and purpose. A target that leaves out what actually empties wallets will look tone-deaf, and that could break people’s trust in the RBI. And more fundamentally, can the RBI really claim to deliver “price stability” if it won’t even look at items that matter most to households?
Moreover, food and fuel inflation eventually seep into core anyway. If fuel is expensive, for instance, transporting things is costlier, which raises the prices of everything. Similarly, if food prices are high, workers demand higher wages, which feeds into the price of everything. Over time, headline and core move together. So does moving to core inflation achieve anything, after all?
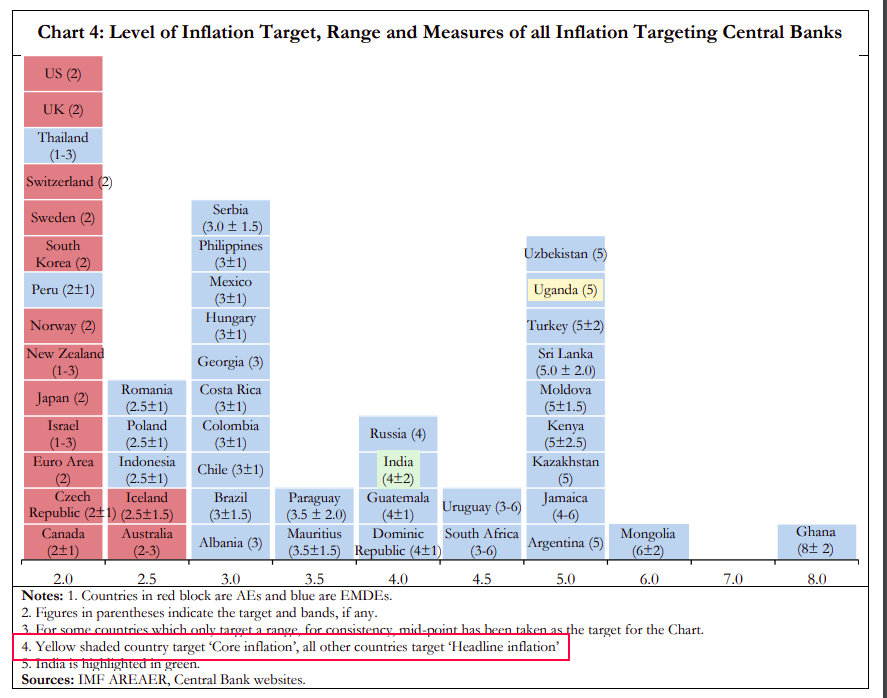
Almost all inflation-targeting central banks use headline inflation. The lone exception is Uganda.
Some economists try to bridge the divide. Mishkin (2007) argues that this isn’t an either–or choice: central banks should emphasise headline inflation over the medium run, but use core inflation as a guide in the short run — that is, they shouldn’t chase temporary spikes, but they should care for how food and fuel behave over time.
So what does the RBI think? It doesn’t take a hard position. This is just a question for its next review.
Is the 4% target correct?
India has lived with a 4% inflation target, with a ±2% band, since 2016. Has it served us well? On balance, yes. Average inflation has been lower than in the pre-2016 years, and the target gave households, businesses, and markets a clear anchor.
But the world has changed in the last ten years. Should this target change too?
For that, let’s look at what others aim for.
Most advanced economies — the US, Euro area, UK — aim for about 2% inflation. That’s their sweet spot: low enough to lock in price stability, but high enough to avoid the “zero-interest-rate trap,” where they run out of options to stimulate growth. It also matches their reality: in conditions of slow growth and ageing populations, inflation naturally tends to be lower.
Emerging markets, by contrast, live with higher targets — typically 3–6%, and often with a band. Their economies are more volatile with supply shocks being more common. Growing populations often strain prices. Fast growth rates, too, can create inflation. You can’t treat them by using the same yardstick.
Now, imagine India cuts its target to 3%. Sounds great on paper — who doesn’t like lower inflation? But the RBI’s research shows that it simply isn’t practical. Even if you strip out temporary shocks, India’s trend inflation still hovers around 4%.
There’s also an interesting phenomenon RBI paper leans on, known as the Balassa–Samuelson effect: when a country like India becomes more productive in industries that trade globally, like IT services, wages in those sectors rise. But that drives up wages and prices in other sectors too. After all, an IT worker buys the same thing barbers, teachers or delivery workers do. They end up bidding the price of those things. That pushes up the prices of local services faster than in rich countries.
Now, if advanced economies are comfortable with about 2% inflation, India’s faster productivity growth adds on top. Empirical studies suggest this effect contributes roughly 2 extra percentage points to India’s inflation compared with rich countries. Which means India’s “natural” inflation rate ends up closer to 4%.
If the economy’s natural drift is around 4% and you set a lower target, you’ll simply miss it. And if you do that enough, you have no credibility.
What about targeting above 4%? Well, the obvious question is: if we can aim for lower inflation, why raise the bar?
Now, if you tolerate a bit more inflation, you could add more money to the economy, and give growth some breathing room. But the core purpose of inflation targeting is anchoring expectations. Inflation is the most stable wherever the RBI targets it to be. If the RBI raises that target, it signals comfort with higher inflation. Workers will demand more, firms will hike prices faster, and prices will spiral.
Even after Covid, in fact, when every central bank revisited its framework, no major central bank raised its target. In fact, some emerging peers lowered theirs — but only after years of delivering predictable outcomes. India hasn’t yet built that track record; we’re still earning credibility.
So, should we simply stick to 4%? That’s the question RBI has put on the table, although it carefully reminds us why 4% has been the anchor so far.
The band
Finally, let’s look at the “band” — the breathing room RBI has. Most peers use ±1 to ±1.5 percentage points. India has stayed wider at ±2. Why? Well, our shocks are bigger and more frequent. Narrowing the band would force the RBI to react more sharply, and more frequently. Widening it would hand RBI too much leeway. What you need is balance.
To sum up
We’re not economists, but we do understand report cards. And a good report card has to do two things: grade what really matters, and grade only what can actually be delivered.
That’s exactly what’s at stake here — in the choice of inflation measure, the target number, and the width of the band. The RBI’s paper invites answers on all three. It makes a solid case for the current 4% framework — without ruling out change.
How China’s economy beat ours: The human capital story
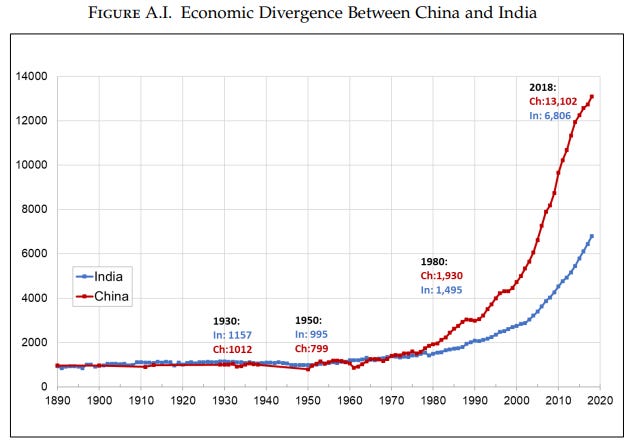
There’s a fundamental question about our fate, as an economy, that we all keep coming back to: how did China, a country as complex as ours, beginning from roughly the same point in the 1980s, leave us so far behind? What explains graphs like this?
Many different answers have been offered to this question: ranging from our political systems, to our respective cultures, to when and how our two countries liberalised their laws. And all of them get to some of the truth.
Today, though, we’re looking at a piece of this puzzle that generally receives less attention: the different choices we made in developing the human capital of our two countries. The twentieth century saw most of the world embrace modern education. Countries took different approaches to getting there; making different choices on how to get the most out of the meagre resources they had. A few decades on, the effects of those choices are becoming apparent.
At least some of the difference in India and China’s economic trajectories — perhaps more than we imagine — lies in those very choices. That’s the subject of an interesting paper we came across, by Nitin Kumar Bharti and Li Yang for the World Inequality Lab.
The three decisions that changed everything
Imagine you were observing the world from the middle of the twentieth century.
Educating the two most populous countries on Earth — India and China — must both have seemed like daunting prospects. We were both terribly poor countries. Meanwhile, we had hundreds of millions of people — many of whom barely earned enough to survive — to whom we were trying to give a modern education.
Neither country had the resources to create a full-fledged, world-class education system. Both would have to make choices — they would have to pick their priorities, allocating scarce resources to solve a few problems, while leaving the rest for later generations.
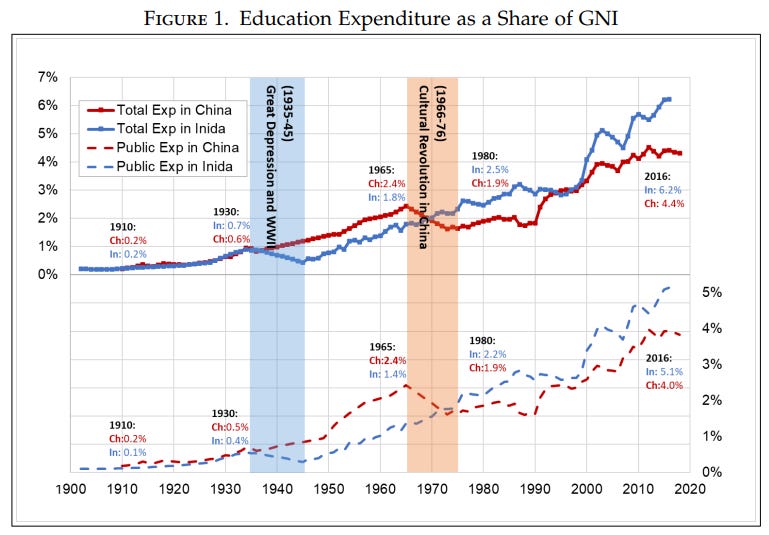
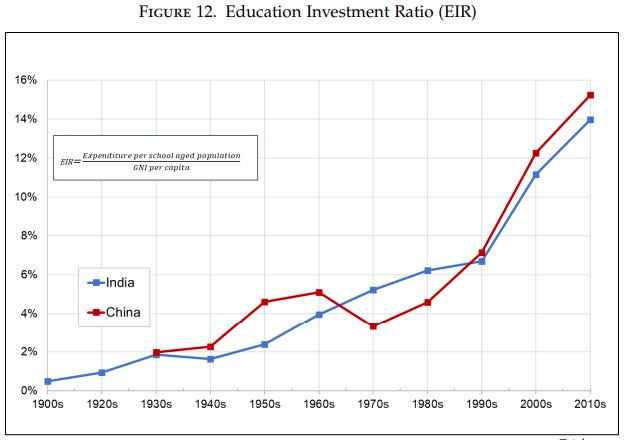
Both India and China invested similar amounts in “education” over the last century. But they both took very different approaches. And this, arguably, made all the difference.
To Yang and Bharti, there were three major ways in which our choices diverged:
Bottom-up vs. top-down education
The first question before us was: if you didn’t have the money to give everyone everything from primary to university-level education, where would you focus? Would you bring everyone to the same, low baseline, even if nobody had the ability to study too far? Or would you spend on pushing a small part of your population all the way to the graduate level and beyond, while leaving the rest behind?
China took the first approach — what the authors call a “bottom up approach‘. India took the latter; a “top-down approach”.
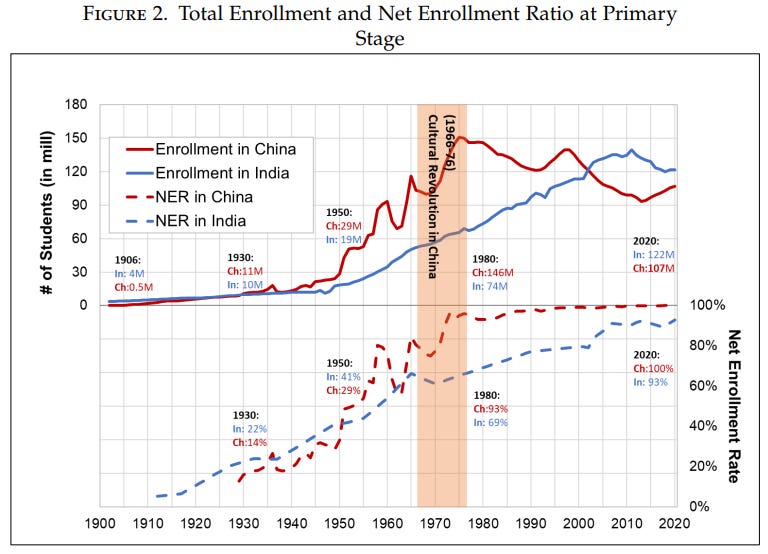
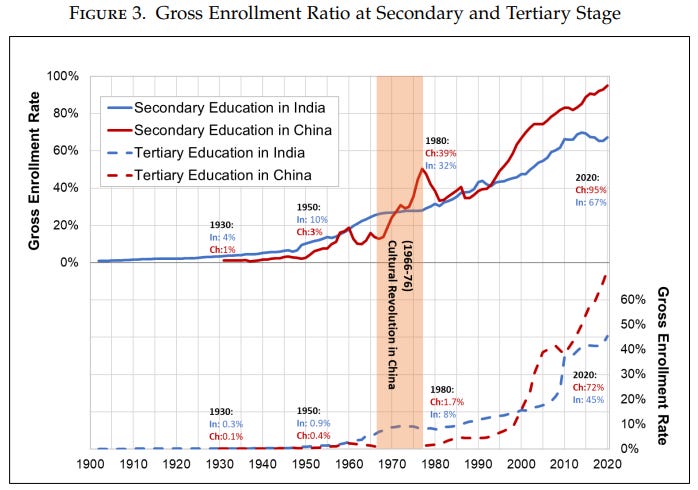
China focused on building up its base. Till the 1950s, it focused solely on mass primary education — trying to get everyone to a point where they had basic literacy. Then, between the 1960s and the 1980s, it shifted its focus on giving everyone secondary education. Only recently, after it reformed its economy and grew relatively rich, did it start spending on universities.
India, in contrast, bet on its elite. Its focus, after independence, was on creating high quality universities, which could prepare a highly educated administrative class for the country. It was only in the 1990s that we made a serious push towards universal primary education.
Quantity-first vs. quality-first
The second big question was on how much to invest in quality of teaching. Would you try and cover as many people as you could under the net of “education” — even if your teaching standards were poor? Or would you expand more slowly, but try attracting better teachers?
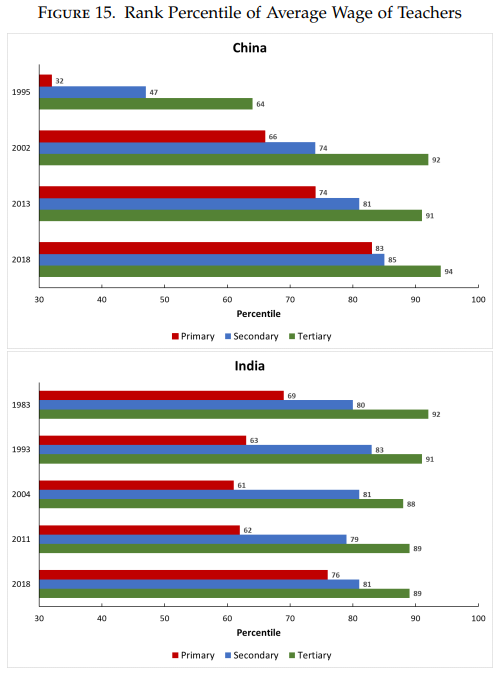
China did the former. It mass-hired teachers at low salaries, while keeping class sizes smaller. Those teachers were paid worse than many other professions. In the 1990s, for instance, the average Chinese primary school teacher’s salary was at the 32nd percentile.
India, on the other hand, tried attracting a smaller pool of teachers, who were paid more. At least in theory, this would attract a better cohort of teachers, even if each was managing a larger class. In the 1990s, for instance, being a primary teacher paid at the 63rd percentile — making it a relatively attractive profession. This would get more pronounced the higher you go. Indian secondary teachers, for instance, were in the top 20% bracket of our country by pay, while Chinese secondary teachers, too, were paid below the median.
Practical education vs. humanities-focus
The third question had to do with what type of education both countries prioritised. Would you push for vocational training? STEM education? Or would you teach the humanities, or commerce?
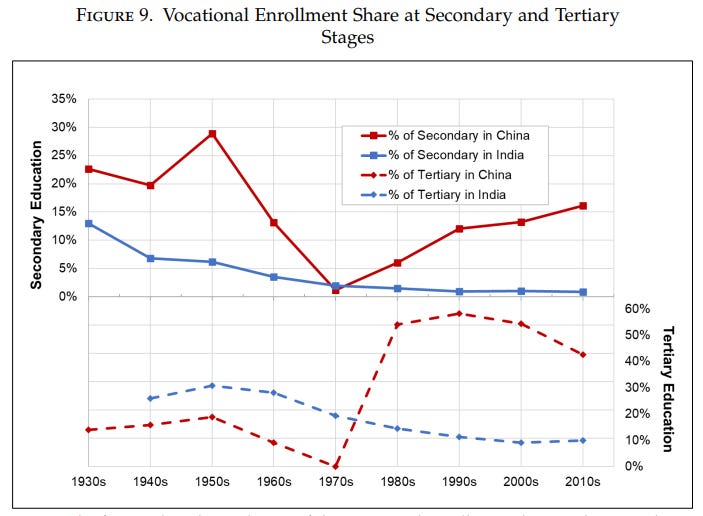
China took a Soviet-like approach from the start, gearing its education system towards heavy industry. Nearly a quarter of Chinese secondary school students are enrolled into vocational training, compared to less than 2%, in India.
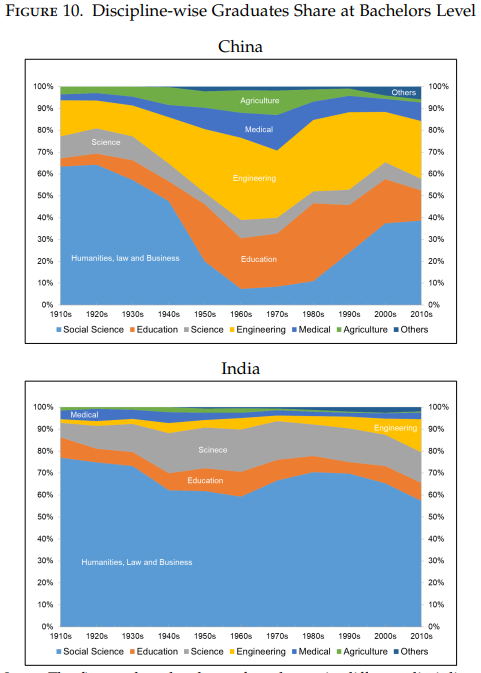
Its graduate-level education was dominated by engineering — even at the height of its cultural revolution, 35% of its graduates went into engineering. Just 5% of India, meanwhile, became engineers. It’s only recently that Indians have embraced engineering colleges.
India had inherited its tertiary education system from the British. And this system was built to push out humanities and accounting graduates — aimed at creating clerks and public administrators for the colonial system. Independent India continued this legacy, in part because it was cheaper to teach the humanities than STEM-oriented courses. For most of the 20th century, in fact, 60% of India’s graduates were in the humanities or social sciences.
What these choices meant
India had a massive headstart in its project of educating its population.
The British began a modern education program back in 1854 — half a century before China did, in 1905. But the two countries took very different approaches. From the start, China wanted to create an industrialised state. India, meanwhile, didn’t have the autonomy to do so — our educational system was built around the Raj’s needs.
When we became independent, however, we continued the approach we had inherited.
Within a couple of decades of independence, a clear gap had opened up. Only ~10% of the Chinese born in the 1960s became illiterate — compared to ~49% in India. That gap has widened considerably since. Interestingly, India arguably matches China’s spending on education, relative to its income levels. But its choices have been very different.
Many of our economic differences, the authors argue, are an outcome of those choices.
Quicker spread
China, because of its choices, was quicker to educate its population than we were — even if, for a lot of that time, it delivered a poorer education.
By the 1970s, for instance, more than 90% of China’s children were already enrolled in primary school. India only got there in 2011. It backed this with a massive adult literacy program. In 1976, for instance — as part of its otherwise-disastrous “cultural revolution” — 160 million Chinese adults were enrolled in adult education programs. In India, that figure was barely above 1 million.
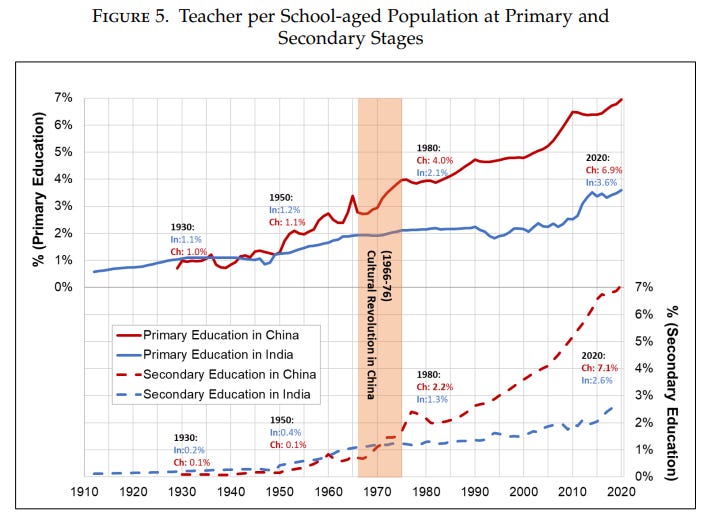
China also created a far larger cadre of teachers. In the 1930s, for instance, China had one-fifth fewer primary teachers than India. Today, they have twice as many as us.
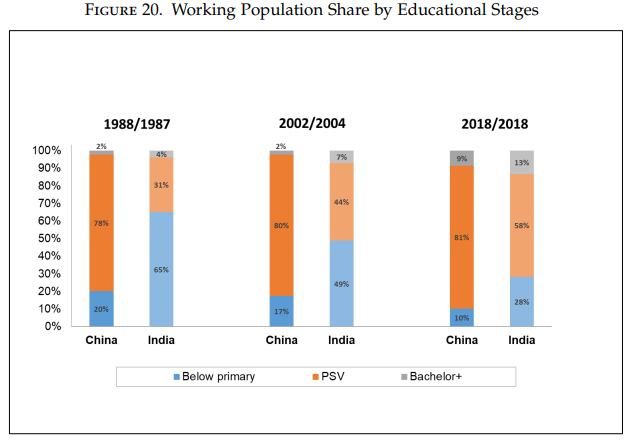
All of this meant that education spread across Chinese society far quicker than it did within ours. By the time China liberalised its economy, primary education was already mandatory across the country. This meant that all of China’s workforce had at least a low level of skill when economic opportunities started ballooning.
India, meanwhile, liberalised in 1991 without that foundation. We had a small, highly educated elite, on top of a poorly educated base. It was this small group that captured the opportunities that were created then.
A “missing” workforce
Interestingly, for most of the last century, India produced more graduates than China. At the same time, we also had many more illiterate people than China. We had a “missing middle”, and that’s where China beat us — a lot more of China had primary, secondary and vocational education than us. This informed how both countries progressed after liberalisation.
The part of our workforce that we could invest in became as capable as anyone in the world. That is, perhaps, the hidden secret behind our services boom. Sadly, the parts that were left behind were hardly suited for most jobs — without the basic ability to read or write, even menial factory-floor jobs were closed to them. This continues to be a problem: three-fifths of the Indians that work in agriculture — the least productive part of our economy — have a below-primary level of education. It’s incredibly hard for them to move out.
A lot of our highly educated workforce, too, is unfit for our economy — often because that education isn’t relevant for the economy. As early as the 1930s, for instance, government reports noted that many of our humanities graduates weren’t being employed. But we have, if anything, doubled down on the humanities. This might have a disproportionate impact on women: given that 60% of Indian women graduates don’t work, compared to just 10% in China.
In a cruel irony, as China has grown richer, it closed the tertiary education gap with India at the undergraduate and PhD levels, and then exceeded it — killing our main advantage over them.
Social stratification
At the beginning of this experiment, both India and China were trying to bring about a structural transformation of their populations. In the middle of the twentieth century, we were both heavily stratified, unproductive, agrarian societies. Modern education, it was clear to everyone, was the way out. As late as 1988, agriculture — the least productive sector — occupied ~62% of both countries’ workforces. For greater prosperity, we needed to shrink this number, re-allocating those workers to better paying jobs.
Perhaps the biggest tragedy of this story is that India, by focusing its efforts on a small elite, ended up amplifying its social issues. Our educational system kept people out by design. It created a new layer of inequality on top of our pre-existing social inequities.
Consider gender. In the 1920s, both China and India had massive gender gaps in education. China closed that gap by the 1980s. India, on the other hand, continues to have gaps. The same is true with caste — even among children born in the 1990s, those in SC/ST groups are nearly twice as likely to be illiterate as others. Without universal education, we’ve tried correcting this imbalance with reservations — but that ends up doing too little, too late.
Overall, according to the paper, 25% of India’s wage inequality comes from differences in education levels — compared to just 12% in China.
This also means that large parts of our economy still struggles to break out of low-productivity jobs like agriculture. By 2018, China had reduced agricultural workers to ~15% of its workforce, while ~40% of ours was still stuck in their farms.
How should you understand this divergence
There’s a lazy way to read a paper like this: you can simply curse India for making the choices it did. But this was an unusually difficult task. Both countries started, from scratch, to educate a large part of the human race, with little money to do so. Back then, perhaps, it was unclear if creating a small, elite cadre of highly educated people would get us there faster, or if we were better off pushing everyone into a weak educational system.
But over the decades, that answer has become clearer. The last century was the “century of human capital,” when literacy levels went up from 20% to 80%. It was when people became “brains, not stomachs” — and this transformation was arguably behind the single largest reason behind the prosperity most of the world enjoys. As one of our most consistent commenters puts it:
We agree.
One of the reasons India has fallen behind so much of the world is that we didn’t invest, in time, in the minds of so many of our people. We thought we were better off beginning with a few. That was, in hindsight, a bad bet.
Our successes are still notable: a lot of us, on The Daily Brief, are ourselves products of Kendriya Vidyalayas and government colleges. We’ve seen, first hand, the best side of India’s education investments. But this paper is important in pointing to the other side — to all the investments we didn’t make.
Tidbits
Indian steelmakers have urged the government to raise import quotas for low-ash metallurgical coke from 1.4 million tonnes to 9.3 million tonnes for July–December 2025. The biggest request is for 2.6 million tonnes from Indonesia, far above the current 66,000-tonne cap. Producers say domestic supply is insufficient, and curbs are hurting expansion plans.
Source: Reuters
India has extended its cotton import duty exemption until December 31, 2025, to support its garment industry facing increased U.S. tariffs of up to 50%. This move is expected to boost imports to a record 4.2 million bales this year, easing pressure on textile mills amid reduced U.S. demand.
Source: Reuters
Jakson Engineers is investing over ₹8,000 crore (approximately $914 million) to establish a 6-gigawatt integrated solar manufacturing plant in Madhya Pradesh, marking the state's largest solar investment to date. The facility, covering 110 acres in Maksi Phase II, will produce solar modules, cells, and wafers, with production of modules slated to begin by May 2026 and cells by September 2026.
Source: Reuters
India’s domestic air traffic fell 2.94% YoY to 1.26 crore passengers in July 2025, according to DGCA data. Air India Group’s passenger count dropped to 33.08 lakh. In contrast, IndiGo strengthened its market share to 65.2% from 64.5%, though it carried fewer passengers than in June. Akasa Air and SpiceJet saw slight market share gains to 5.5% and 2% respectively.
Source: Business Standard
- This edition of the newsletter was written by Kashish and Pranav
📚Join our book club
We've started a book club where we meet each week in JP Nagar, Bangalore to read and talk about books we find fascinating.
If you think you’d be serious about this and would like to join us, we'd love to have you along! Join in here.
🧑🏻💻Have you checked out The Chatter?
Every week we listen to the big Indian earnings calls—Reliance, HDFC Bank, even the smaller logistics firms—and copy the full transcripts. Then we bin the fluff and keep only the sentences that could move a share price: a surprise price hike, a cut-back on factory spending, a warning about weak monsoon sales, a hint from management on RBI liquidity. We add a quick, one-line explainer and a timestamp so you can trace the quote back to the call. The whole thing lands in your inbox as one sharp page of facts you can read in three minutes—no 40-page decks, no jargon, just the hard stuff that matters for your trades and your macro view.
Go check out The Chatter here.
Check out “Who Said What? “
Every Saturday, we pick the most interesting and juiciest comments from business leaders, fund managers, and the like, and contextualise things around them.
Subscribe to Aftermarket Report, a newsletter where we do a quick daily wrap-up of what happened in the markets—both in India and globally.
Thank you for reading. Do share this with your friends and make them as smart as you are 😉





Useful updates👍
Great read!