

Welcome back to Beyond The Charts. This series is where we break down what's happening in the world of finance and the economy through charts in a way that's easy to understand.
If you are one of those few who missed Beyond The Charts, we have been on a hiatus to freshen things up, and we will make sure not to disappear again, at least not unannounced.
Prefer video? You can watch it here:
It might feel like 2025 just started, but we’re already halfway through the year. And the past six months have packed in more twists than an entire season of a Netflix show. From sudden policy changes to rising trade tensions and geopolitical flare-ups, both the global and Indian economies have been on a bit of a rollercoaster.
One of the biggest developments has come from the US, where a major shift in economic policy is already shaking things up. A fresh wave of tariffs and large government spending plans have added a new layer of uncertainty for businesses, consumers, and investors.
President Trump’s announcement of new tariffs on April 2nd was a big turning point. The average US tariff rate now stands at 15.8%, as you can see in this chart by JP Morgan. These are the highest levels in nearly 90 years. Even though it’s lower than what was first announced on what some dubbed “Liberation Day,” it still marks a sharp break from past trade policies.

This uncertainty has created a “wait and watch” mood across the economy. Businesses are holding back on investments. Households are pausing big purchases. Everyone seems to be waiting for more clarity before making any major decisions.
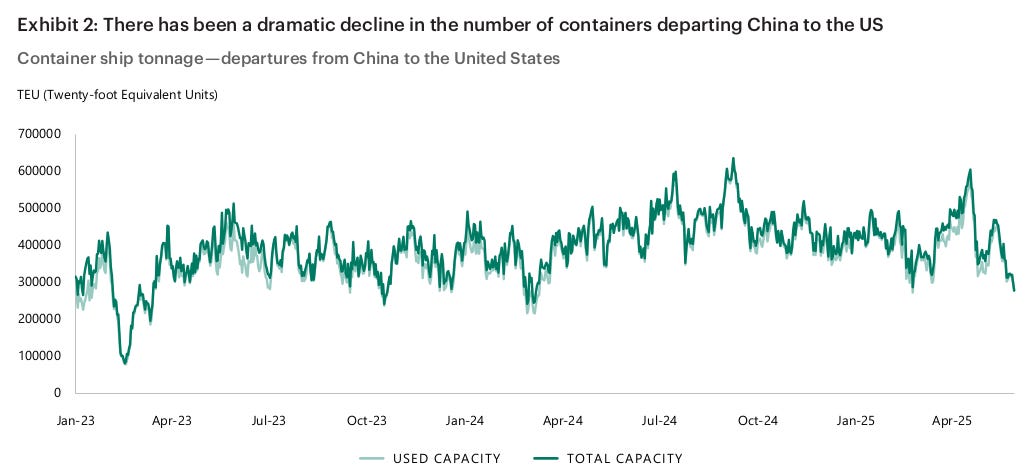
One clear sign of this slowdown is a sharp drop in the number of containers leaving China for the US, as seen in this chart by Apollo Global Management. It’s an early signal that trade flows are already being affected.
But trade isn’t the only source of concern. The US fiscal outlook is now another big question mark.
The new “One Big Beautiful Bill”—includes major tax cuts and big spending reductions. It’s estimated to add about $5 trillion to the national debt over the next decade. If that happens, the US budget deficit could widen sharply, pushing the debt-to-GDP ratio to around 129% by 2034.

Geopolitical tensions and market reactions
And that’s not all. Geopolitical tensions are also making things more complicated. The Israel-Iran conflict and shifts in US sanctions policy have added yet another layer of uncertainty to the global picture.
Surprisingly, global markets have stayed calm. After the flare-ups on June 13th and 22nd, the S&P 500 went up by 1.6%. The MSCI All Country World Index rose slightly by 0.3%. Even oil, which usually jumps during Middle East conflicts, dropped—Brent by 2% and WTI by 3.8%, as seen in this chart from MUFG.

Why Iran matters for energy?
Iran’s role in global energy markets is a big reason why this conflict matters. The country holds the third-largest oil reserves—about 12% of the world’s total. It also has the second-largest natural gas reserves and ranks third in gas production globally.

And when it comes to buyers, Iran leans heavily on China. Nearly 90% of its oil exports go to China, making that relationship a key economic lifeline.

The surprising fall of the US Dollar
One of the biggest surprises of 2025 so far has been the fall of the US dollar. The dollar index dropped by 10.7% in the first half of the year—the sharpest first-half decline since 1973, and the weakest six-month performance since 2009.
Why is the dollar falling? There’s no single reason—it’s a mix of things. The dollar had become overvalued. US economic data has been weaker than expected. Concerns are growing about rising US debt. And some countries are pushing back against US trade and sanctions policies.
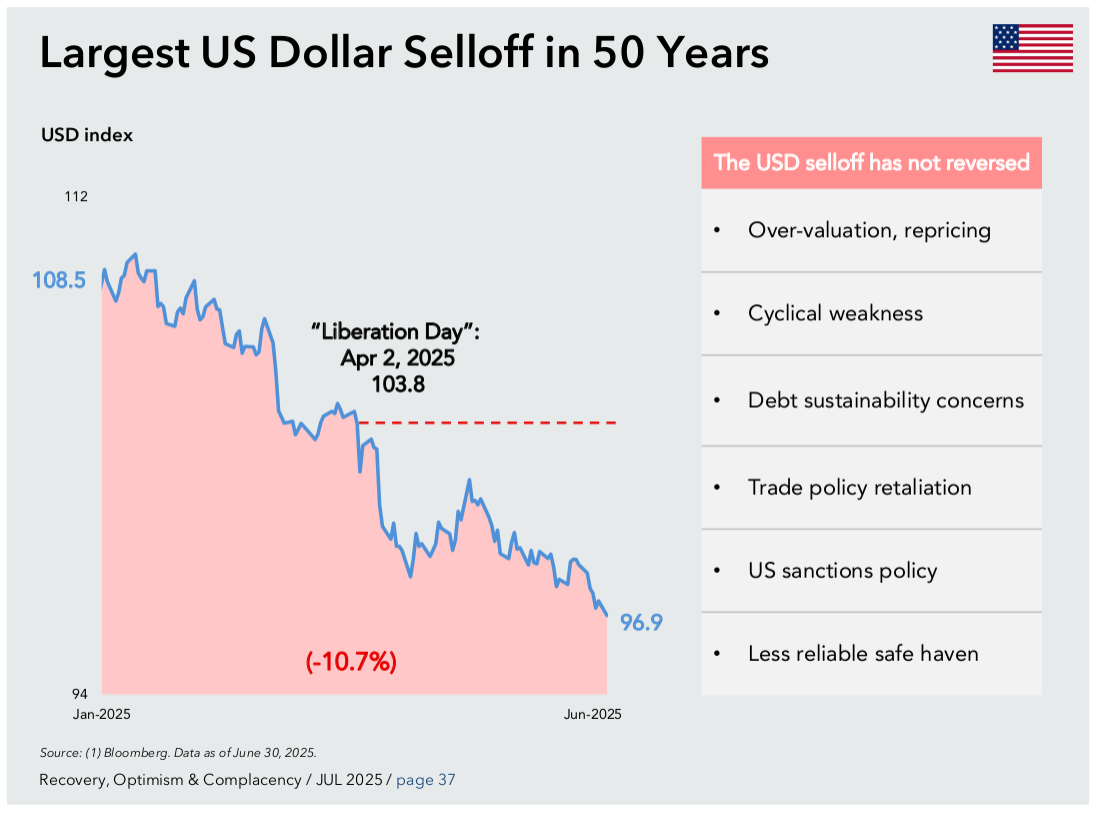
Here’s another interesting thing, which HSBC pointed out in its mid-year outlook report. Normally, when the US bond yields rise, the price of the dollar also increases. But right now, the opposite is happening; even as the yields are going up, the price of the dollar is falling due to economic uncertainty.
It’s also a sign that investors might be starting to look beyond the dollar for safer places to park their money.

Capital markets
Even with all this uncertainty, capital markets are showing a mixed picture. Some parts are bouncing back, while others are staying cautious.
Take global mergers and acquisitions (M&A), for example. Deal volumes are up 25% this year, but most of that growth is due to a few massive deals. In fact, the total number of deals in the first half of 2025 was the lowest in 20 years.


So while big companies with deep pockets are still willing to make big moves, smaller deals are likely being delayed or scrapped due to all the uncertainty.

IPOs
Equity fundraising in the US is up 7% so far this year. But IPO activity is still down 11%, showing that companies are hesitant to go public.

Instead, many are choosing to stay private longer. In 2024, the average age of companies going public was 14 years, up from just 8 years in 2004, as shown in this chart from BlackRock.
Private markets now offer easier access to money, with fewer rules and more flexibility than public markets. Venture capital and private credit give companies the funding they need, without the pressure of quarterly reporting.

Bonds
At the same time, big, financially strong companies are raising record amounts through bond sales—more than in any other first half of the year, except for during COVID. This shows that companies are leaning on more stable ways to raise funds in uncertain times.

There’s also strong demand from investors for corporate bonds, especially those from solid companies. That shows a clear trend: investors are being cautious and looking for safety.
Riskier high-yield bonds did pick up in May and June, but overall, fewer of them have been issued this year.

Meanwhile, the bond market has been caught between mixed signals, inflation on one side and signs of slowing growth on the other.
In the first half of 2025, yields on US government bonds have generally come down. The 10-year Treasury yield, which is a key benchmark for global interest rates, stood at 4.47% by mid-May.
The yield curve has started to normalise too, with long-term bonds sometimes doing better than short-term ones. But overall, yields have stayed within a narrow range.
The term premium—the extra return investors want for holding long-term bonds—is rising again after years of being flat or even negative. That could mean investors are starting to worry more about long-term risks, like rising debt or inflation swings, and are demanding a higher risk premium for holding these bonds.

Stocks
Global stock markets have held up fairly well this year, but US equities have taken investors on a bit of a ride. Both the S&P 500 and NASDAQ saw sharp declines after the April 2nd tariff announcements, only to bounce back and climb above their earlier levels.

Despite the recovery, global stocks overall have outperformed US markets.

For most of the last 15 years, the U.S. has been the world’s growth engine—leading in stock market returns, attracting global money, and setting the tone for trade and innovation. But in the first half of 2025, that story is starting to show some cracks.

Foreign investors are starting to pull back or hedge their bets on the U.S. The dollar is losing ground, even during times of market stress, as we saw earlier. U.S. stocks look expensive, and government deficits are still running at levels we usually see during a crisis.

And perhaps the biggest sign of change, money is moving. European and Asian stock markets are seeing their biggest inflows in years. With all this happening, it’s only natural to ask: Is the era of U.S. exceptionalism coming to an end?

Rise of private capital
Private capital is now playing a bigger role in funding areas like infrastructure, energy, and AI. With many governments facing tight budgets, they’re increasingly turning to private investors to help meet their infrastructure goals.

Private infrastructure assets under management are expected to cross $2 trillion in assets by 2028, especially in the US and Europe.
Defense spending
Rising geopolitical tensions are also changing how countries think about national security, trade, and global alliances. One clear sign of this shift is the steady increase in defense spending.
For the first time in years, European NATO members are now meeting the long-standing target of spending 2% of GDP on defense. Germany has announced a massive €1 trillion stimulus plan focused on defense and infrastructure. Japan isn’t far behind either—it has boosted its defense budget by 9.4%.

Now let's take a look at some India-specific data.
The Reserve Bank of India (RBI) recently released its Financial Stability Report (FSR) for June 2025. This twice-a-year report gives a deep dive into how India’s financial system is doing. It covers everything from banking and credit trends to stress tests and global risks.
Let’s explore some of the most important insights from this report.
The global economy today feels like a ship sailing through thick fog, uncertain and facing constant challenges. In the FSR’s foreword, RBI Governor Sanjay Malhotra pointed out one of the major shifts:
“The announcement of large tariffs by the US administration in April has set in motion a new paradigm in trade and economic policy.”

As a result, global growth forecasts are being downgraded. Major institutions like the IMF, OECD, and World Bank now expect the world economy to grow more slowly than earlier projected.

India’s growth holds steady
While things don’t look very bright for the global economy, they do for the Indian economy. On the back of good macroeconomic fundamentals, smart policies, and strong domestic growth, the Indian economy is expected to grow at 6.5% in 2025–26, matching the pace from the previous year.

Inflation is also softening. The headline consumer price index (CPI) hit a six-year low of 2.8% in May 2025, and food inflation dropped to just 1.5%, easing pressure on households.

Liquidity boost
Earlier this year, it became harder to get loans as liquidity tightened. But since April, the RBI has stepped in to ease the crunch. It added ₹9.5 lakh crore into the system by buying government bonds and using other tools to inject money into banks.
The RBI also reduced the Cash Reserve Ratio (CRR)—the portion of deposits banks must hold with it—by 1 percentage point in phases between September and December. This move will unlock another ₹2.5 lakh crore for banks to lend.
One sign of this shift is what’s called a bull steepening of the yield curve, a fancy way of saying short-term interest rates have dropped faster than long-term ones. That usually signals that investors expect more rate cuts in the future, which could make borrowing even cheaper.

India–US bond yield gap shrinks
Another trend to note: the gap between Indian and U.S. 10-year bond yields is now at a 20-year low. This means Indian bonds are losing their yield advantage over U.S. bonds, which could affect foreign investment flows.

Stock markets
After a sharp drop between October 2024 and February 2025, Indian stocks have mostly bounced back since March. However, Foreign investors have been pulling money out. In fact, their share in Indian stocks has fallen to a 10-year low.

And it’s not just India; across emerging markets, foreign outflows hit nearly US$40 billion in the fourth quarter of 2024. That’s the highest quarterly outflow since the pandemic.
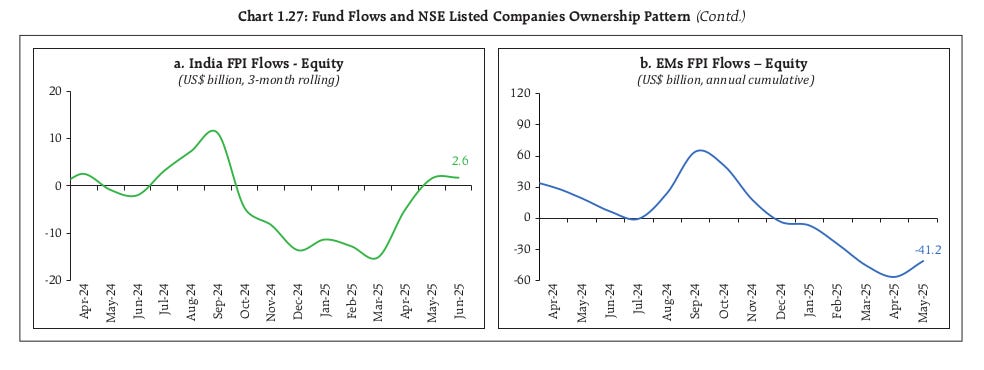
Despite these outflows, Indian markets haven’t seen much pain as domestic investors have stepped up. Mutual funds, insurance companies, pension funds, and retail investors have all stepped in. For the first time in years, Domestic Institutional Investors (DIIs) now own more Indian equities than foreign investors.

While the participation of individual investors has grown in the markets, they still hold a disproportionately large share of microcap stocks, the smallest companies on the market. In contrast, their ownership in large-, mid-, and even small-cap stocks is relatively modest.

Valuations
Valuations have come off their earlier peaks but remain high by historical standards, especially in the mid-cap and small-cap segments.

As of end-March 2025, around two-thirds of listed stocks were trading at price-to-earnings (P/E) ratios above their long-term averages, meaning many stocks are still priced above their typical value range.

The Indian corporate sector has held up well, even amid global trade policy uncertainty.
Companies are managing their debt better and keeping their finances healthy.
While sales growth has slowed a bit for listed private non-financial companies, their profit margins remain strong, showing they’re handling operations efficiently.

However, if tariffs rise further, it could hurt corporate earnings. Analysts have already started moderating profit forecasts.
On the positive side, India’s corporate debt-to-GDP ratio is still low compared to both advanced and other emerging economies. So, even if earnings dip, companies have enough room to manage.

Banking sector
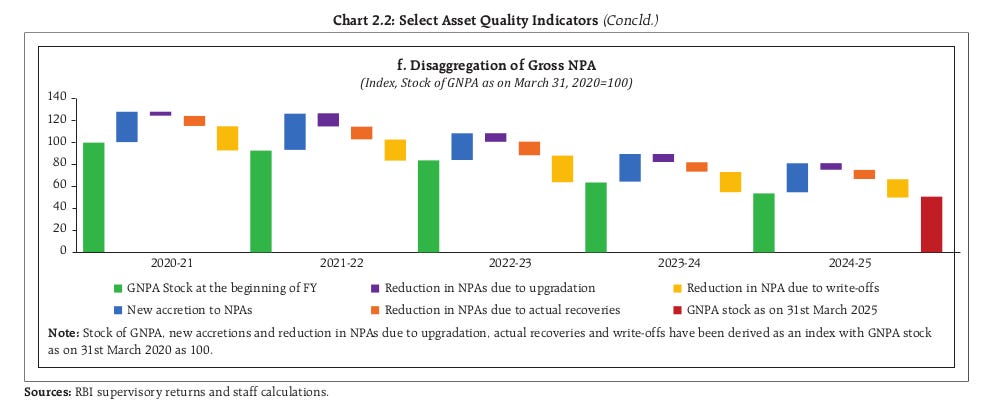
India’s banking sector is looking excellent right now.
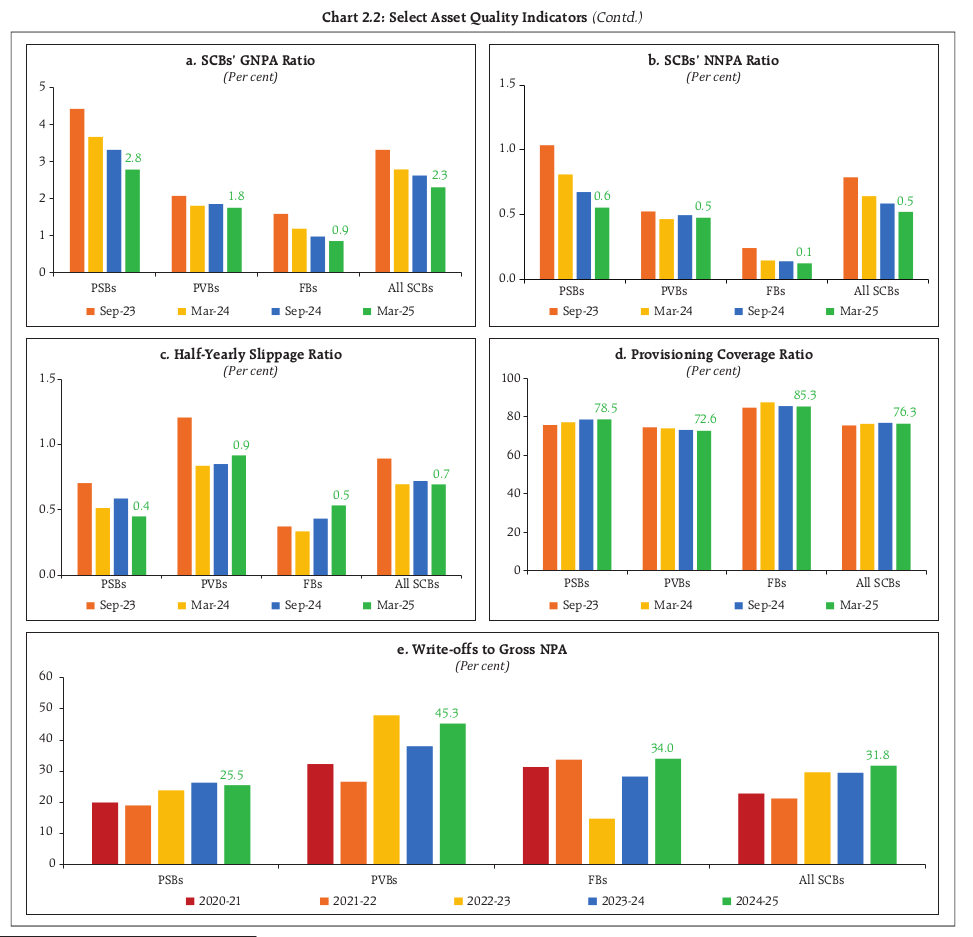
Scheduled Commercial Banks (SCBs) have high capital buffers, plenty of liquidity, and solid earnings. And their loan books are healthier than they’ve been in decades.
As of March 2025:
Gross NPA (bad loans): 2.3%
Net NPA: 0.5% (Both at multi-decade lows)
CRAR (Capital to Risk-Weighted Assets Ratio): 17.3%—a record high

This isn’t a one-off improvement. These numbers have been improving steadily thanks to years of cleanup and tighter lending standards.
And according to stress test results, even in worst-case economic scenarios, Indian banks would still stay well above minimum capital requirements.
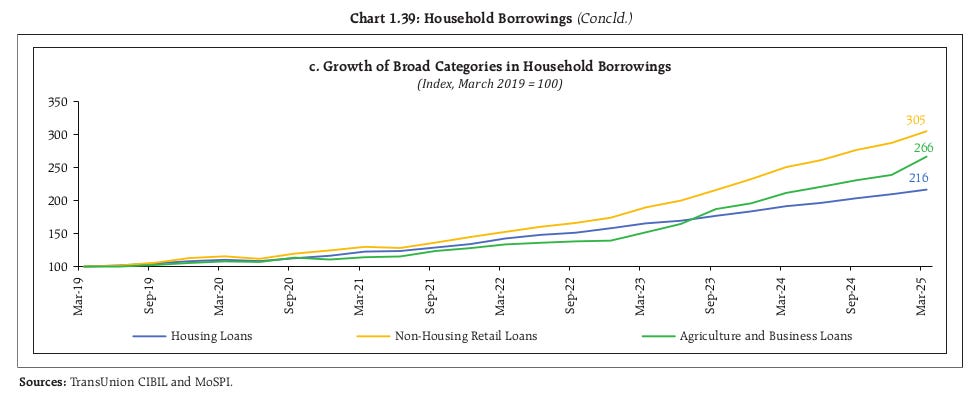
Household debt is rising, but still manageable
India’s household debt rose to 41.9% of GDP by December 2024. That’s still low compared to other emerging markets, but it’s something worth keeping an eye on.

The main driver? A surge in personal loans, credit card dues, and consumer finance. These now make up 55% of all household debt, growing much faster than home or farm loans.

The good news is that most of this new borrowing is from high-rated borrowers—individuals with stronger credit histories.
The rise (and risk) of Non-Bank Financial Institutions
Non-bank financial institutions (NBFIs)—like asset managers, insurers, private equity, and hedge funds—are playing a much bigger role globally and in India.
By the end of 2023, they held 49.1% of all global financial assets.
Many of these institutions use a lot of borrowed money (leverage) to boost returns. If there’s a sudden market shock, they may be forced to quickly sell off positions, which can trigger market-wide disruptions.
The FSR also warns that since banks and NBFIs are increasingly linked, trouble in one can easily spill over to the other, posing a risk to the entire financial system.

India’s Non-Banking Financial Companies (NBFCs) are in good health overall. Most have:
Strong capital buffers
Healthy margins
Low levels of bad loans
However, their loan growth has slowed recently. That’s mainly due to the RBI increasing risk weights on certain types of lending, making it more expensive for NBFCs to grow aggressively.
Systemic Risk Survey
The Systemic Risk Survey (SRS) conducted by the RBI in May 2025 gives a snapshot of expert sentiment on financial risks.
Here’s what they flagged:
Medium risks: domestic growth, consumption demand, inflation, and climate change
Top near-term risks: geopolitical tensions, capital outflows, and global trade slowdown due to tariffs

A key finding from the SRS: there’s a clear confidence gap between global and Indian financial systems. Around two-thirds of respondents said confidence in the global system is falling, but over 90% said their confidence in India’s system is steady or improving.

The survey also breaks down which sectors are seen as most at risk from global trade disruptions. Export-heavy industries like manufacturing, MSMEs in export hubs, and the shipping and logistics sector are viewed as particularly vulnerable in the current environment.

That’s it from us today. Do share this with your friends to spread the word.
If you have any feedback, do let us know in the comments.
I take immense pride in affirming that, as a retail trader, I am able to access the depth and clarity of institutional-grade information through your insightful article. This level of transparency empowers me to make well-informed, fact-based decisions in the capital markets with greater conviction and discipline.
Thank you for bridging the information gap and fostering a more inclusive investing ecosystem.
Great summary! Very well organized and comprehensive!