

Welcome to Beyond the Charts. A series where we break down what’s happening in the world of finance and the economy through charts, in a way that’s easy to understand.
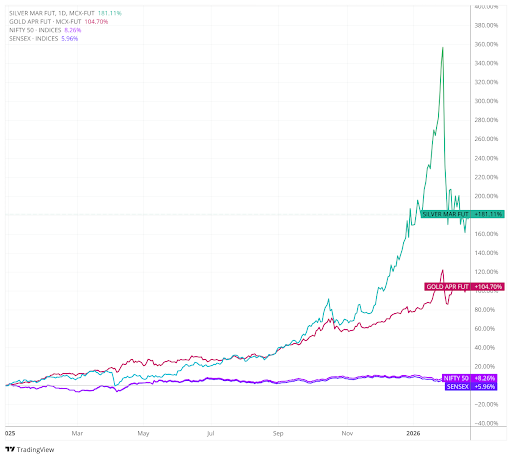
Despite the recent pullback, both gold and silver have seen sharp price increases over the past year. Gold prices are up about 105%, while silver has risen more than 175% since January 2025.
In comparison, Indian equity markets have gained just 6–8% over the same period.
When prices rise like this, it’s not surprising to see money follow.
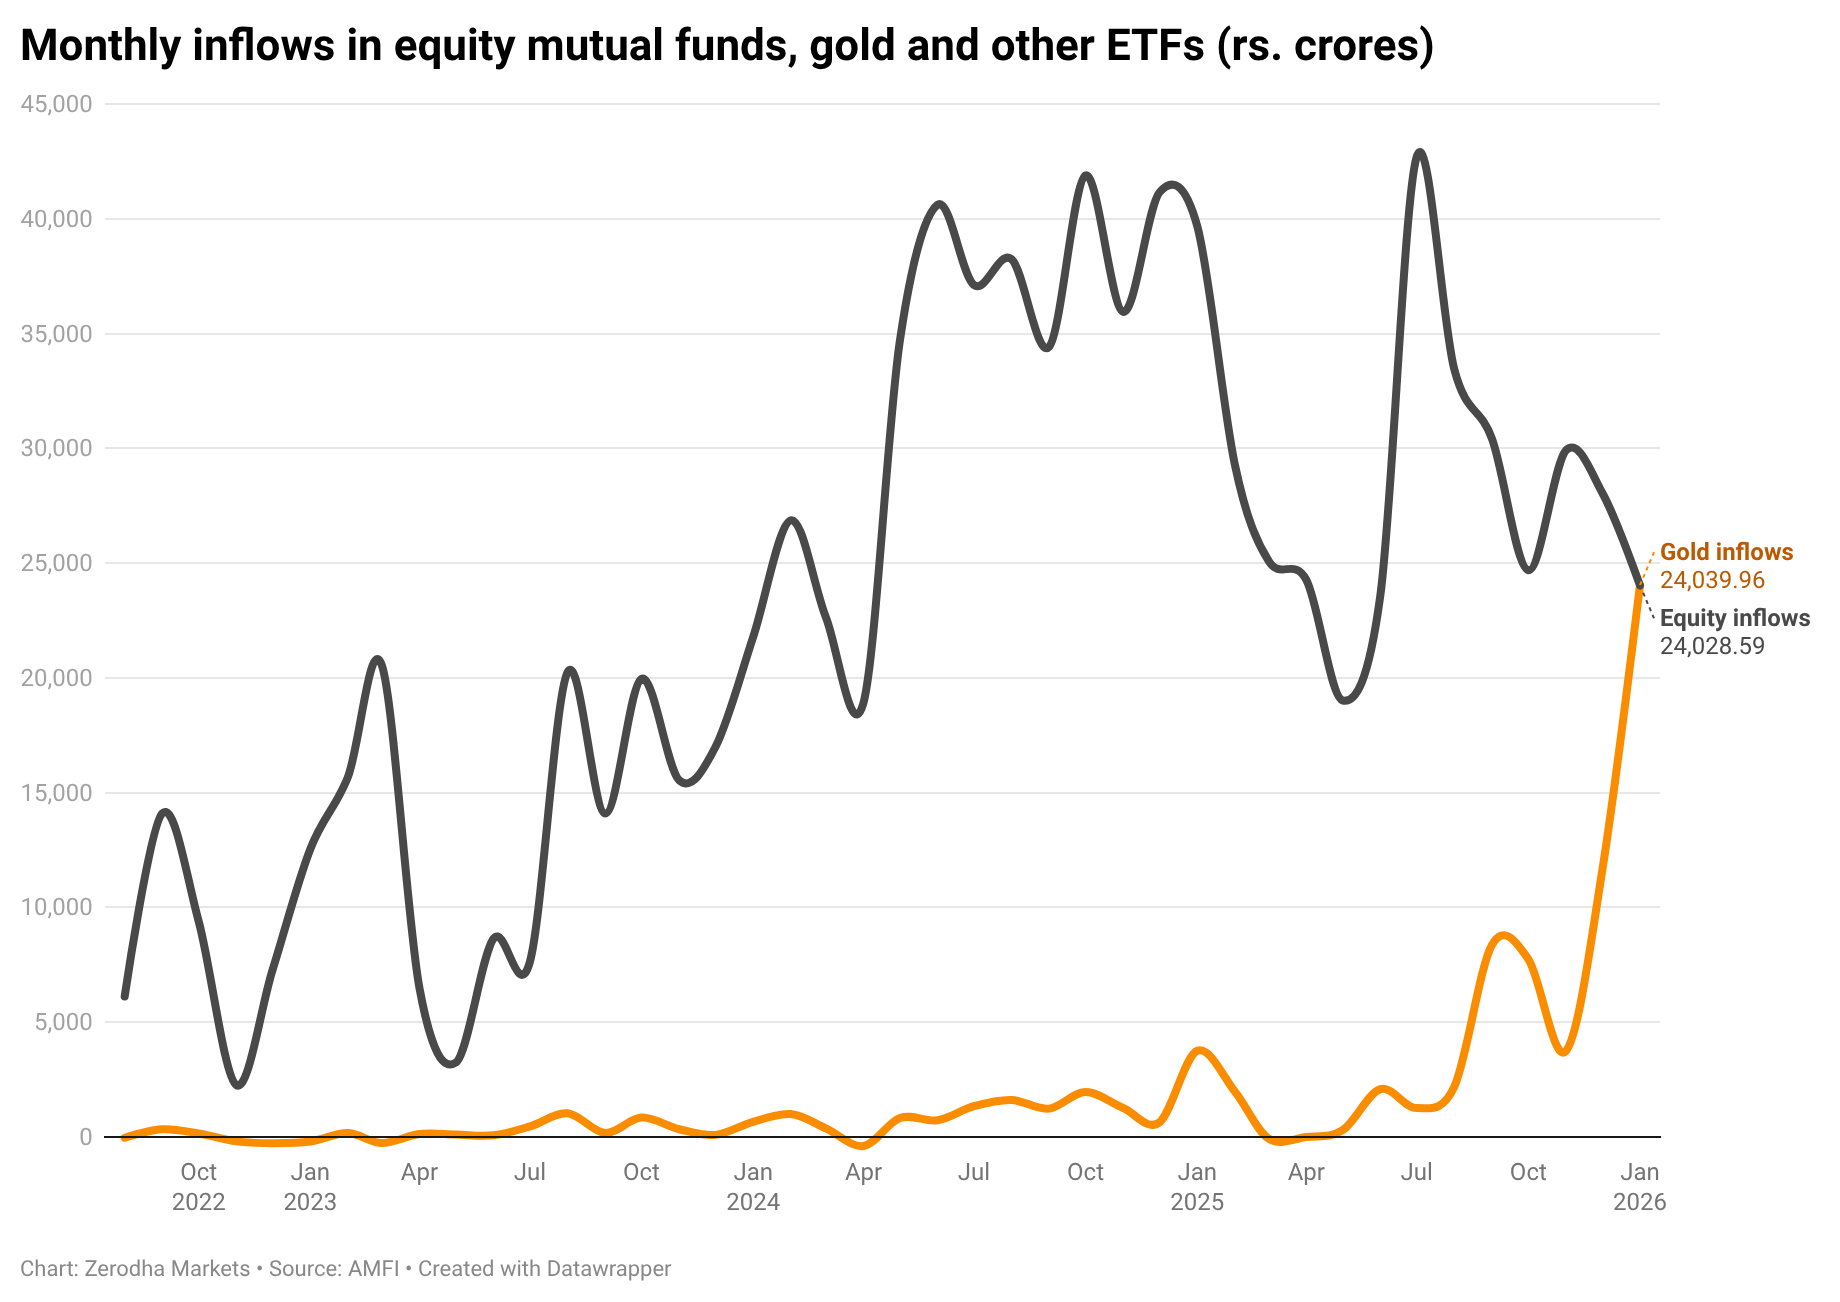
In January, according to AMFI data, gold ETFs received inflows of ₹24,040 crore—more than what equity mutual funds attracted in the same month.
It was the first time that gold ETFs saw higher inflows than equity funds. Silver ETFs also saw strong interest, with inflows of around ₹9,000 crore in January.
Put together, gold and silver ETFs drew in about ₹33,500 crore, compared to roughly ₹24,000 crore in equity funds.
That raises a simple question:
Why are investors still putting money into gold and silver after such a strong rally?
To answer that, we need to step back from India’s monthly flows and look at what happened globally in 2025.
The World Gold Council’s Gold Demand Trends (Q4 & Full Year 2025) makes it clear that 2025 wasn’t just a price story. It was a demand story as well.
Total gold demand, including OTC and other categories, reached 5,002.3 tonnes in 2025—the first time it has crossed the 5,000-tonne mark. During the same year, gold hit 53 new all-time highs. The total value of demand rose to about US$555 billion, up roughly 45% year-on-year.
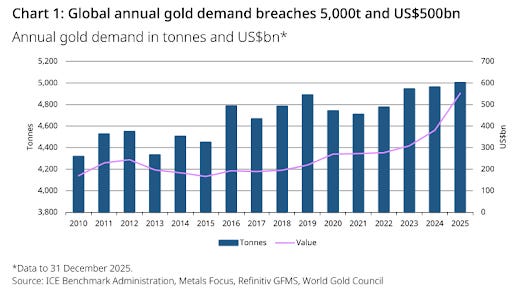
It’s rare to see record volumes and record prices at the same time. When that happens, it usually means the rally isn’t being driven by just one set of buyers.
But the numbers alone don’t tell us why investors are still adding gold after such a sharp move.
The World Gold Council’s outlook section gives some context. 2025 was marked by ongoing geopolitical tensions, volatility in bond markets, and uncertainty around the global rate cycle. Even though policy rates peaked in many economies, real yields remained unstable, and long-term bond yields moved sharply.
In that kind of environment, gold starts to look less like a commodity and more like portfolio insurance. For institutional investors, ETF flows often reflect diversification decisions. For central banks, continued buying signals an effort to reduce dependence on the US dollar and build reserves in a politically neutral asset.
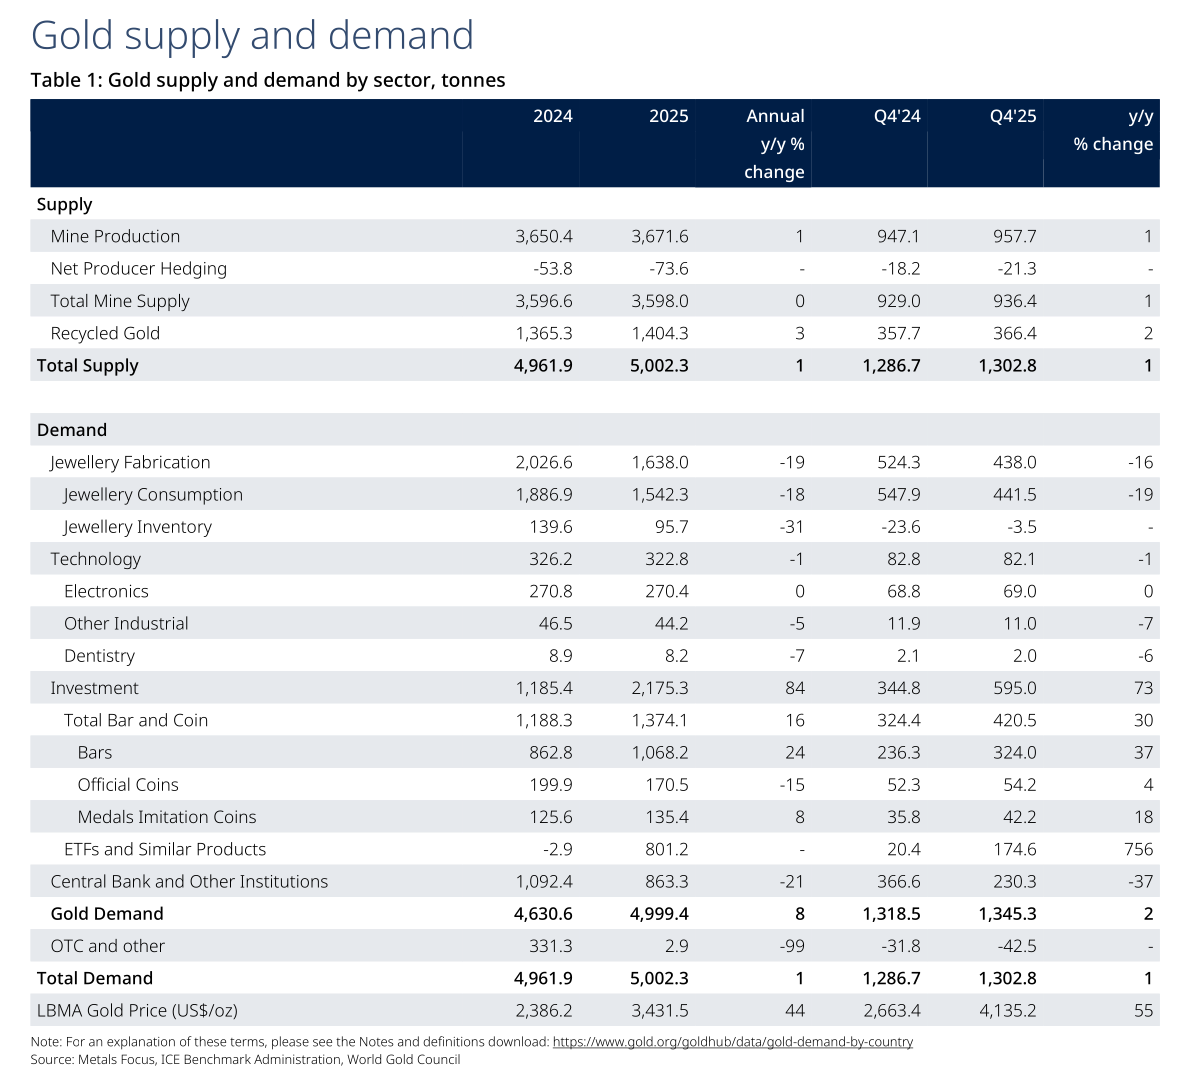
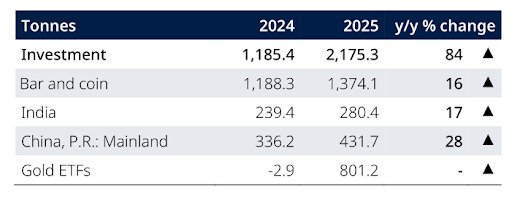
The biggest shift came from gold ETFs and similar products. In 2024, ETF demand was slightly negative at –2.9 tonnes. In 2025, it swung sharply to +801.2 tonnes—making it one of the strongest years on record for ETF inflows.
ETF flows matter because they reflect a different mindset than jewelry buying. They usually represent portfolio decisions—investors reacting to uncertainty, adjusting diversification, or responding to price trends—rather than everyday consumption.
ETFs weren’t the only investment channel that grew. Bar and coin demand rose to 1,374.1 tonnes in 2025, up from 1,188.3 tonnes in 2024 — a 12-year high. This points to another type of buyer: households and individuals purchasing physical gold, often influenced by currency moves, affordability, and the comfort of holding something tangible.
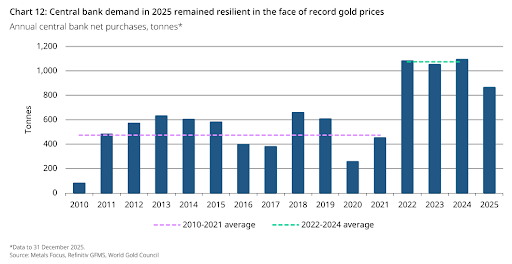
Central banks continued to be a key source of demand. Net purchases in 2025 stood at 863.3 tonnes. That’s still high by historical standards, though lower than the 1,092.4 tonnes bought in 2024.
The report describes central bank buying as resilient and spread across regions. At the same time, it notes that purchases have slowed from the more than 1,000-tonne pace seen in each of the previous three years.
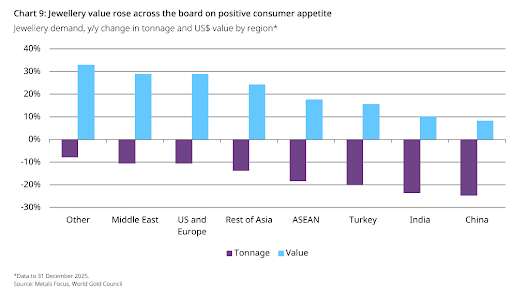
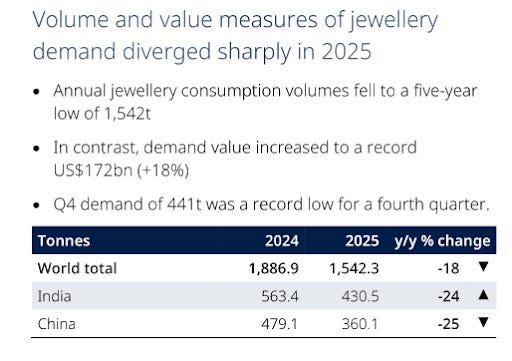
This is where the impact of higher prices becomes most visible. Jewelry demand fell in volume terms—global jewelry consumption dropped from 1,886.9 tonnes in 2024 to 1,542.3 tonnes in 2025. But spending didn’t fall. In fact, the report says the value of global jewelry demand rose 18% to a record US$172 billion.
In simple terms, people bought fewer grams because gold was expensive—but they still ended up spending record amounts because prices were much higher.
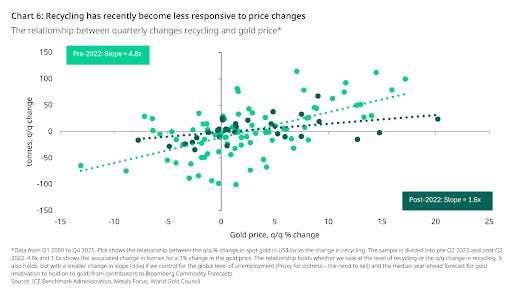
There was another subtle but important shift on the supply side. Recycling increased only slightly, even though prices had risen sharply. Historically, higher prices usually bring more recycled gold into the market. But in 2025, that response was limited. As a result, the market depended more on mine supply and investor demand instead of recycling easing the pressure.
Recycled supply rose by just about 3% to roughly 1,404 tonnes. The report describes this as a “muted response,” especially considering the US dollar gold price had risen by around 67%.
India reflects this shift in buying behavior quite clearly. Jewelry demand fell sharply from 563.4 tonnes in 2024 to 430.5 tonnes in 2025, a decline of about 24%. At the same time, bar and coin demand rose from 239.4 tonnes to 280.4 tonnes, up roughly 17%.
When prices are high, the festival and wedding-driven demand usually slows in terms of volume. But the store-of-value instinct often remains strong—and sometimes even strengthens. India doesn’t stop buying gold; it simply changes the way it buys it.
There’s another interesting layer here. As gold prices surged, loans backed by gold jewelry also rose sharply. The report notes that retail loans against gold jewelry in India reached record levels in 2025.
That tells us something important. High prices don’t just shift demand—they change how gold is used within the financial system. Gold becomes collateral. It becomes a source of liquidity. It becomes part of the credit cycle.
In other words, gold’s role expands when uncertainty rises.
If gold is largely a “money and confidence” metal, silver is more of a hybrid. It behaves like a precious metal during periods of stress, but it’s also a key industrial input.
That dual nature is one reason silver tends to move more sharply than gold—both on the way up and on the way down.
But there’s another factor behind the sharper moves: market tightness.
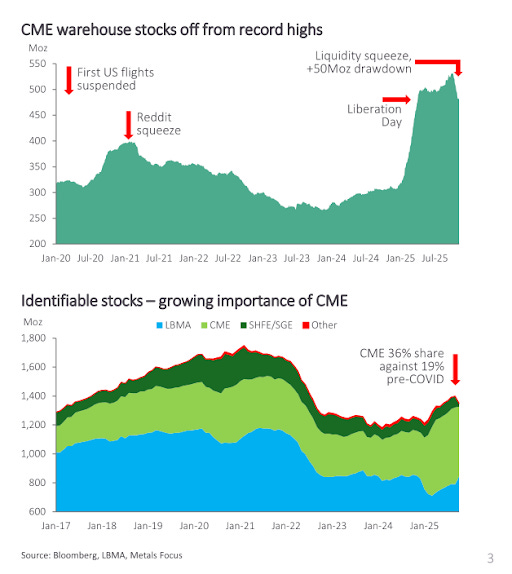
The Silver Institute report points to a liquidity squeeze in parts of the London market during 2025, along with unusually high lease rates. There was also a surge in futures deliveries on the CME and a spike in exchange-for-physical activity levels not seen since the COVID disruptions.
When a market has been running structural deficits for several years and inventories have already been drawn down, even a modest increase in investment demand can push prices higher quite quickly.
Silver isn’t rising only because investors are buying it. It’s rising in a market where supply is tighter than it may seem at first glance.
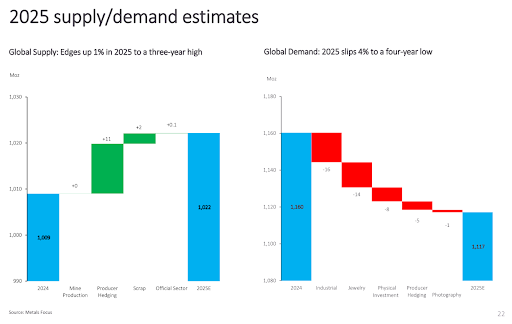
According to the Silver Institute’s Interim 2025 Review, 2025 marked the fifth straight year of a sizeable supply deficit. Global demand is estimated at around 1,117 million ounces, while supply is projected at about 1,022 million ounces—leaving a gap of roughly 95 million ounces.
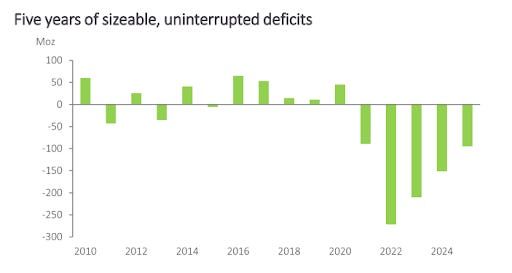
This wasn’t a one-off imbalance. When deficits persist for several years, inventories gradually get drawn down. That leaves the market tighter even before any new wave of investment demand shows up.
And in 2025, investment demand did show up.
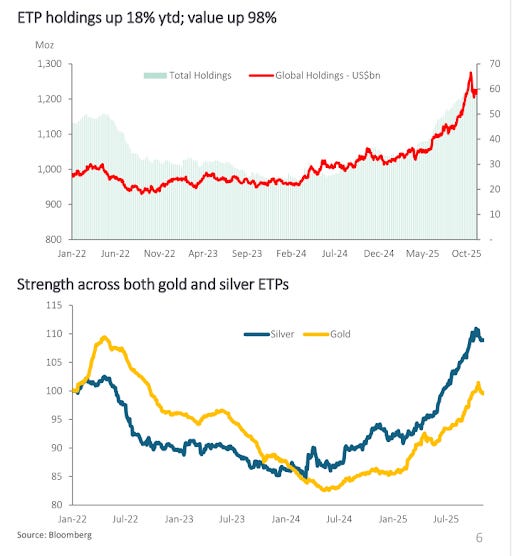
Silver ETP holdings reached record levels during the year, both in terms of volume and overall valuation. That mirrors the resurgence we saw in gold ETFs—but in silver’s case, it happened in a market that was already structurally tight.
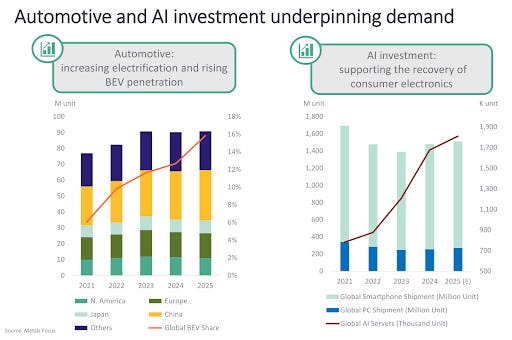
Unlike gold, silver also has a strong industrial driver—solar photovoltaics.
A decade ago, solar made up a much smaller share of industrial silver demand. Today, photovoltaics are one of the largest and fastest-growing uses of silver. The report shows that solar demand has increased sharply over the past decade and remains a key structural driver of consumption, even as manufacturers work to reduce the amount of silver used in each cell.
At the same time, electric vehicles and data centre infrastructure are adding to demand. EVs use more silver than traditional internal combustion engine vehicles. Data centers—which support AI and cloud computing—rely on silver in connectors, circuit boards, and cooling systems.
That means silver’s rally isn’t just about fear or safe-haven buying. A meaningful part of its demand is linked to electrification, digitalisation, and renewable energy.
Meanwhile, mine production hasn’t surged despite higher prices. Supply growth has been relatively flat, which makes repeated deficits more significant.
At the same time, manufacturers are working to reduce silver usage in solar panels by lowering loadings and exploring substitution with copper. So while industrial demand has been strong, the longer-term outlook will depend on how quickly these efficiency gains scale.
That creates an interesting tension. Structural demand is rising—but so is the incentive to design silver out of the system.
There are risks here as well. Changes in solar policy in the US and Europe, tariffs on modules, and continued efforts to replace silver with copper in photovoltaic cells could slow future demand growth.
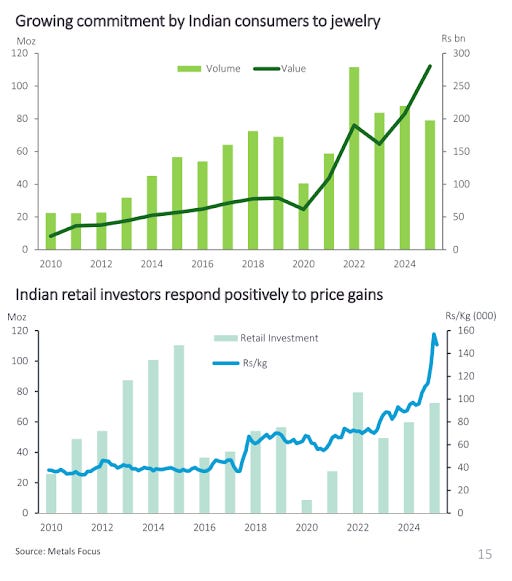
India has also played an important role in the silver story. The Silver Institute notes that India became the largest retail investment market for silver in 2025. Bullion imports were strong during parts of the year, reflecting both investor interest and steady physical demand.
So when we step back and look at the bigger picture, January’s inflows in India don’t seem like a one-off.
Globally, gold saw broad-based demand—from ETFs, central banks, and retail investors. Silver, meanwhile, faced tight supply conditions alongside strong industrial demand.
Money isn’t moving into these metals just because prices have risen. It’s moving because investors are repositioning portfolios in an environment that still feels uncertain—geopolitically, financially, and structurally.
That’s it for this edition. Thank you for reading. Do let us know your feedback in the comments.