

Hello and welcome back to Beyond The Charts. A series where we break down what's happening in the world of finance and the economy through charts in a way that's easy to understand.
The fault in our demographics
Let’s start with something that touches all of us sooner or later—age. For decades, global growth was powered by a steady stream of young workers and booming populations. That “demographic dividend” is now running out. Birth rates have fallen sharply almost everywhere, people are living longer, and the once wide-bottomed population pyramids are slowly turning into tall, narrow towers.
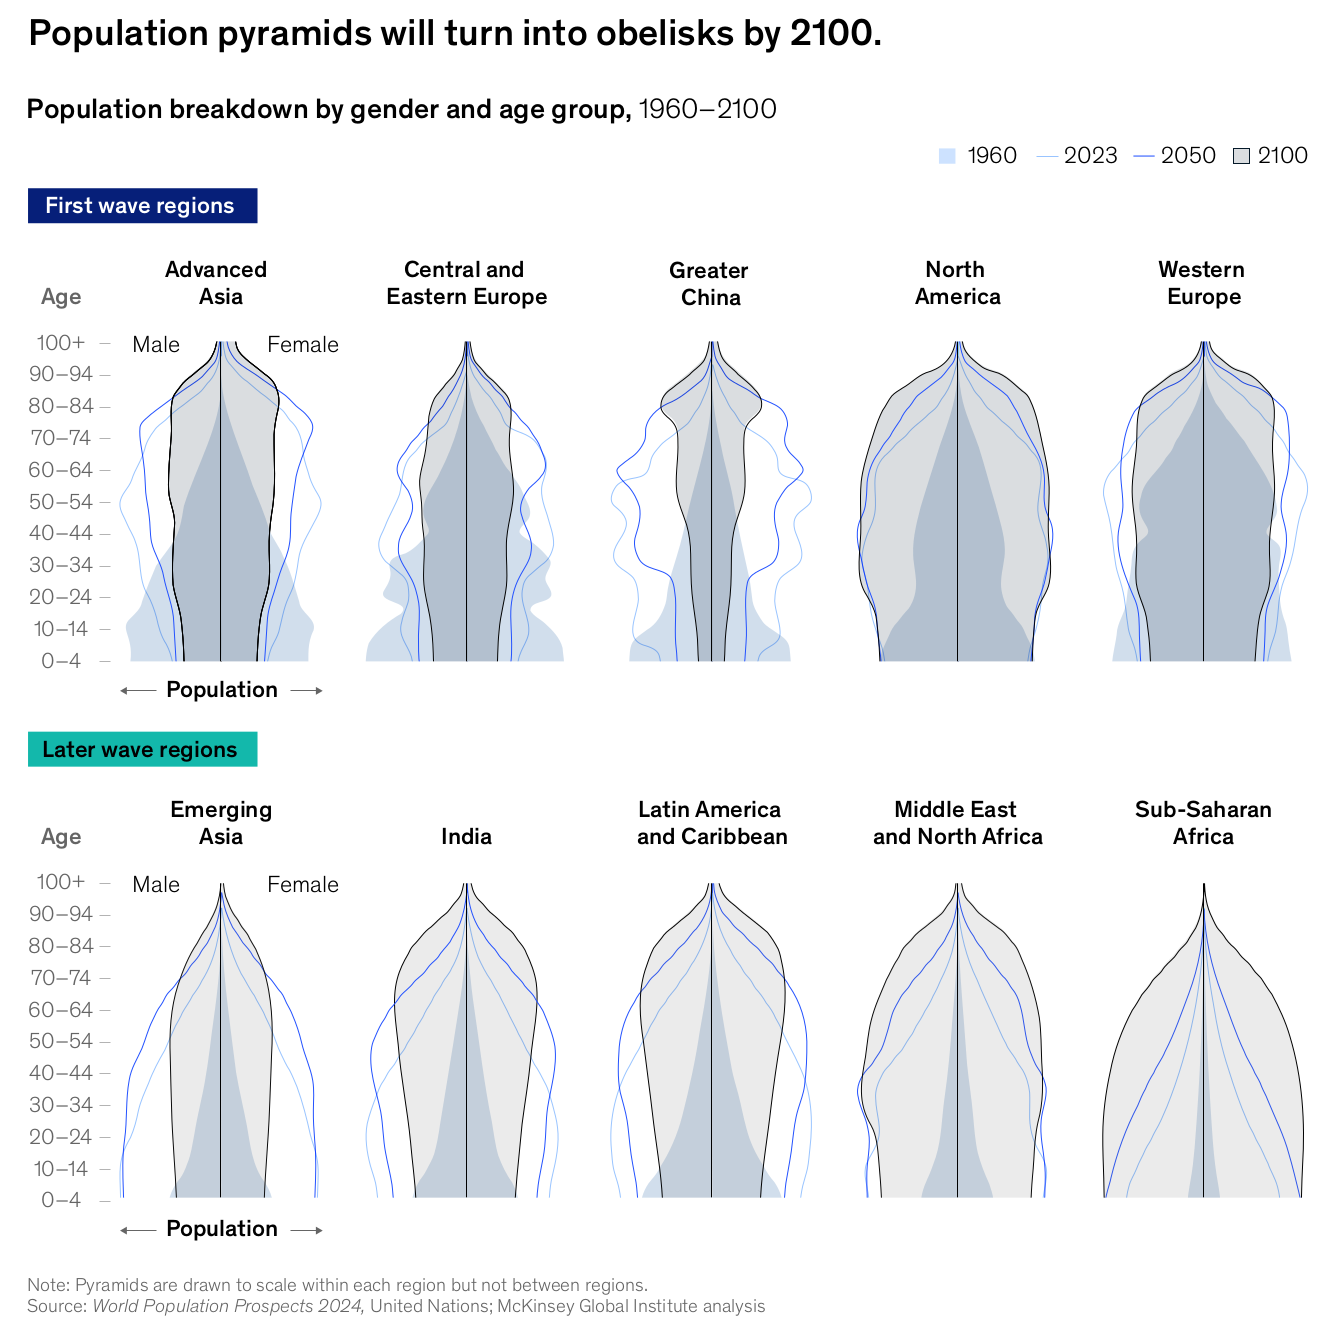
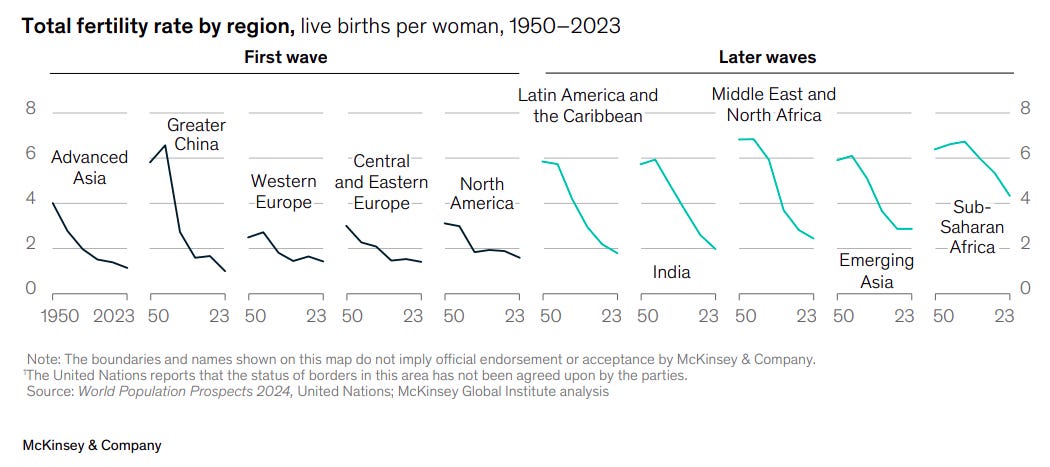
Two-thirds of humanity already lives in countries where fertility is below the “replacement rate” of 2.1 children per woman, according to a McKinsey report. Even India, once thought of as an endless source of young workers, slipped below that mark back in 2019. The only real exception is Sub-Saharan Africa, where birth rates are still high—but even there, the numbers are starting to drift lower.
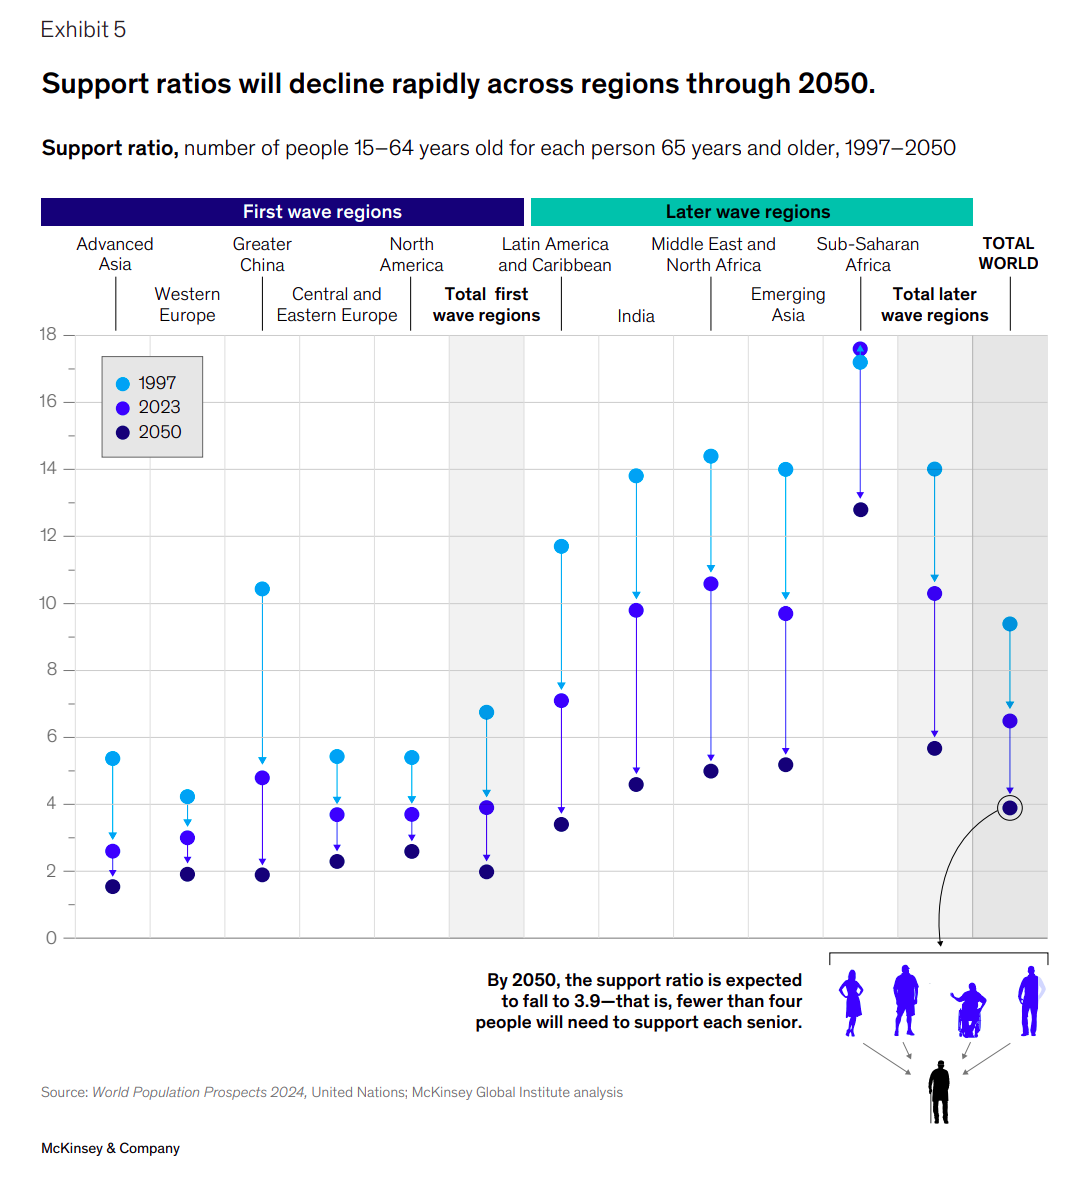
And this drop in fertility is already reshaping what’s called the “support ratio”—the number of working-age people for every retiree. Back in 1997, there were about 9 workers for each retiree. Today, that’s down to 6.5. By 2050, it’s expected to fall to just 3.9. In advanced economies and in China, the squeeze could be even sharper, with only two workers supporting every retiree.
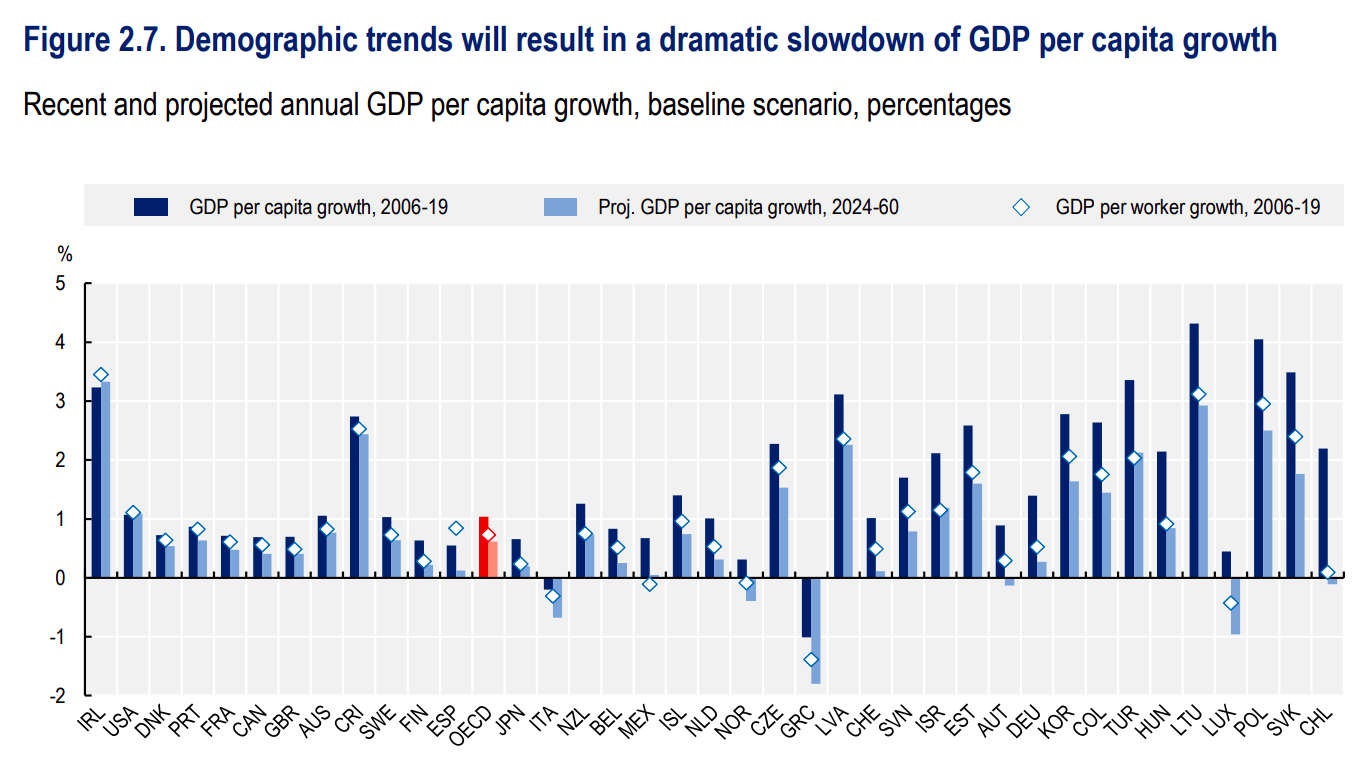
This change also has economic consequences. McKinsey estimates that aging alone will trim about 0.4% off annual per capita GDP growth in advanced economies through 2050. Put another way, that’s like people in Western Europe ending up with around $10,000 less income each by mid-century.
And the OECD paints an even starker picture. It expects annual per capita growth in its member countries to slow by about 40%—from 1% today to just 0.6% by 2050.
But aging isn’t all doom and gloom. The IMF points out that older adults today are living healthier and more active lives than ever before, giving rise to what they call the “silver economy.” This healthier aging could actually add about 0.4 percentage points to annual global GDP growth through 2050—offsetting almost three-quarters of the drag from shrinking workforces. Without these health gains, global growth would have slowed by 1.5 percentage points instead of 1.1.
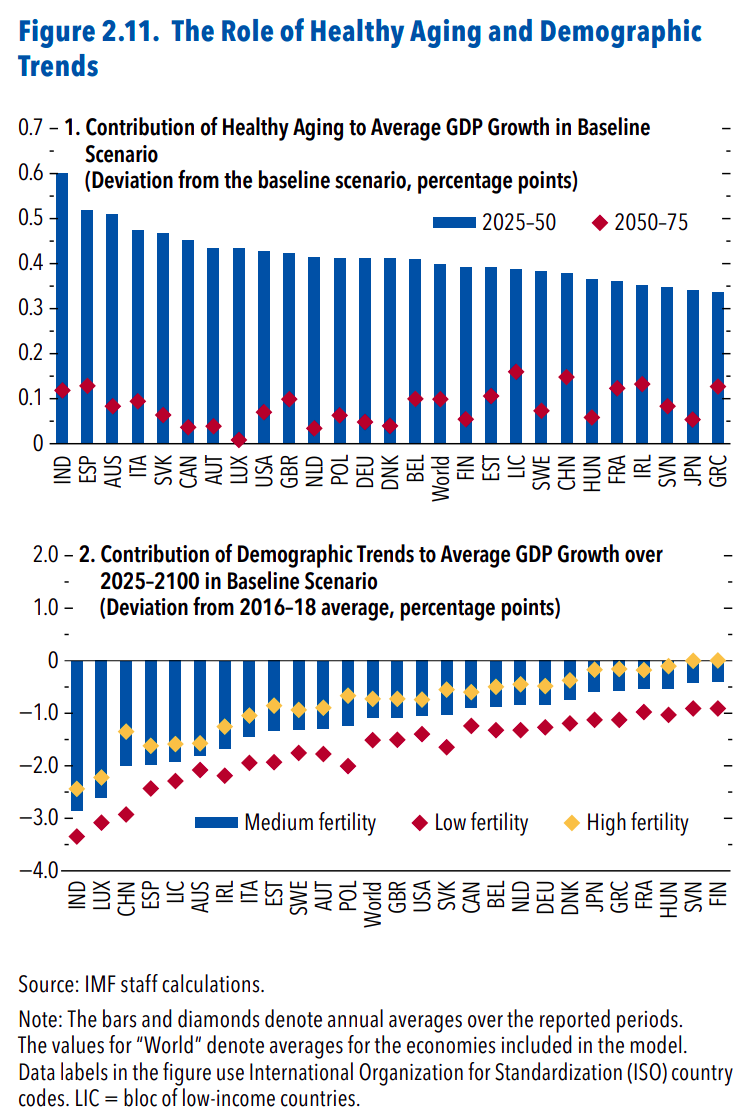
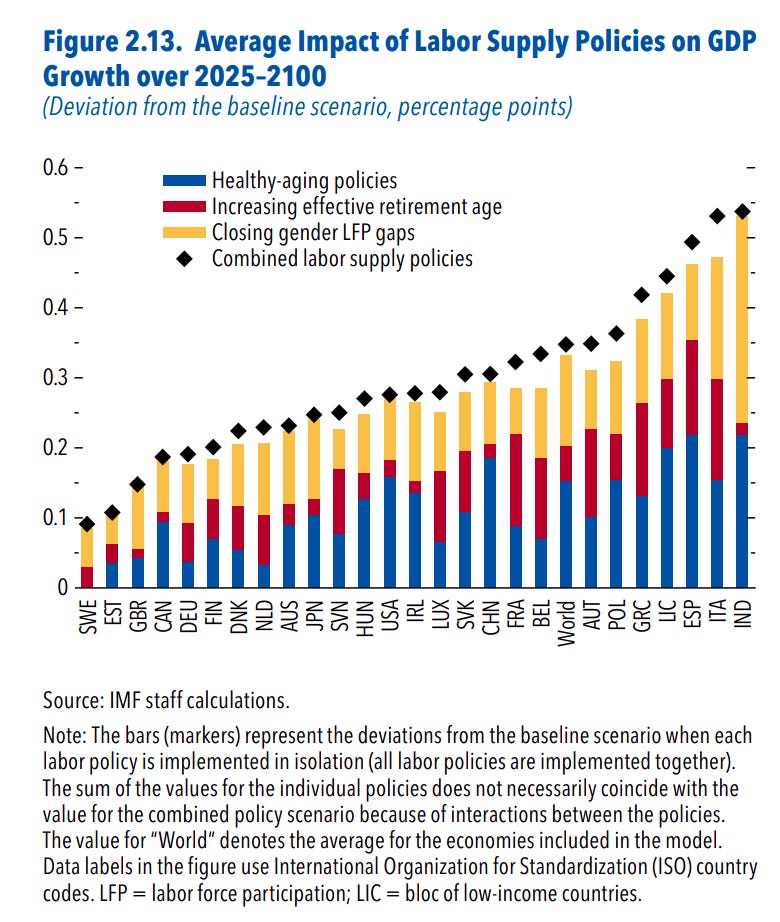
So how do countries actually tap into this silver economy? The IMF highlights three big moves. First, keep older workers healthy and productive—through prevention programs and more flexible work options. That alone could lift annual growth by 0.2% to 0.3%. Second, extend working lives, especially in places where people can expect to live more than 20 years after retirement. That adds another 0.1 point. And third, close gender gaps. In many emerging markets, women’s participation in the workforce still trails men’s by 20% to 30%. Pairing higher participation with smart use of automation—not to replace, but to support experienced workers.
India at a premium
U.S. stocks have traditionally traded at higher valuations because of their size, profitability, and dominance in innovation. But an HSBC report shows that Indian markets are now trading at a premium to U.S. markets.
The chart makes it clear: most regions—China, Europe, Latin America, and other countries—are still at historic discounts compared to the U.S., making India a big outlier. Investors are so confident in India’s growth story that they’re willing to pay more for each rupee of earnings here than for a dollar of earnings in the U.S.
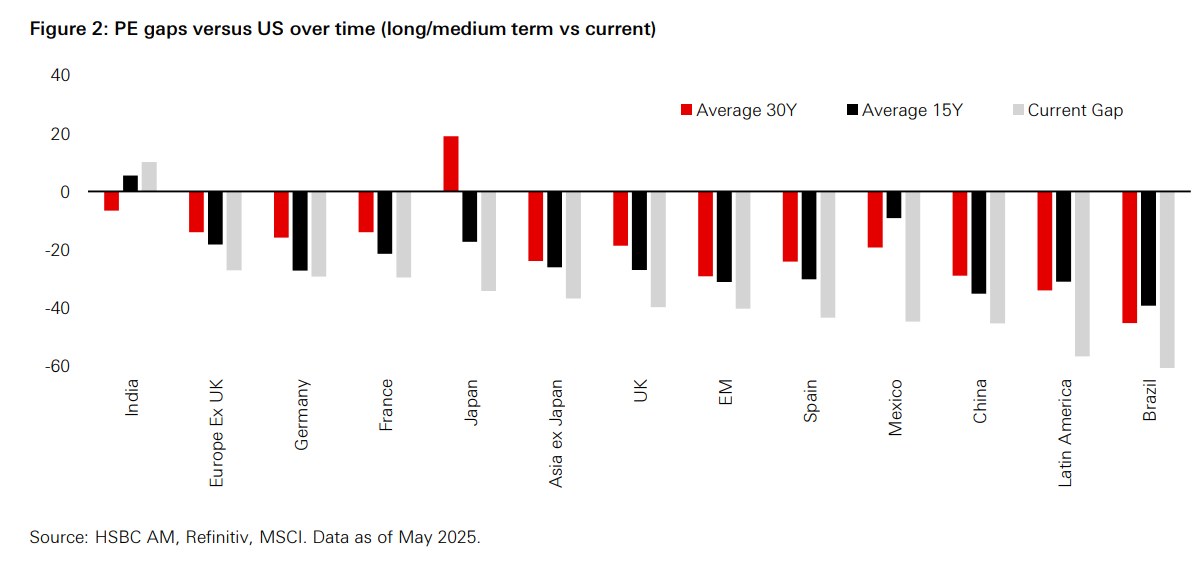
Of course, this premium cuts both ways. On the one hand, it highlights India’s rise as a preferred equity market. On the other hand, it also means valuations are expensive—and corporate earnings will need to keep rising to justify them.
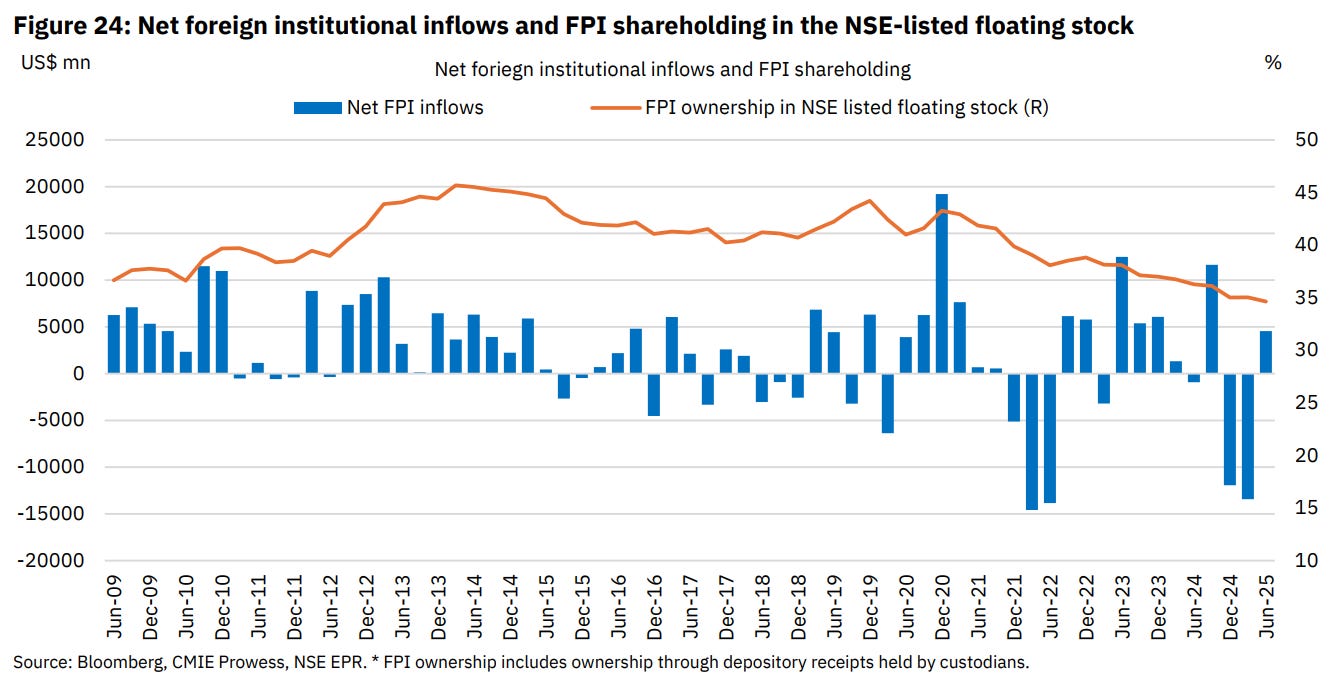
Interestingly, not everyone shares that optimism. Foreign Portfolio Investors, or FPIs, have actually been net sellers in India over the past few years. Their shareholding in listed companies has slipped to about 35%, according to NSE Pulse.
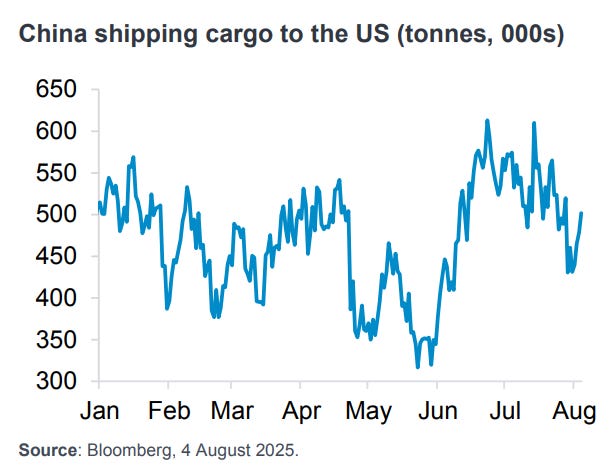
Volatile China-US cargo flows
US President Trump’s tariffs have brought a lot of uncertainty to the world economy. One clear way to see this is through China–US cargo shipments, since the US is the biggest importer of Chinese goods. And those flows have been anything but smooth this year.
As this chart from Fidelity shows, shipments have swung from sudden surges to steep drop-offs as tariffs shifted from sharp hikes to short truces and constant deadline changes. As a result of this flip-flop, importers have been struggling to plan, and that confusion is now showing up in trade flows.
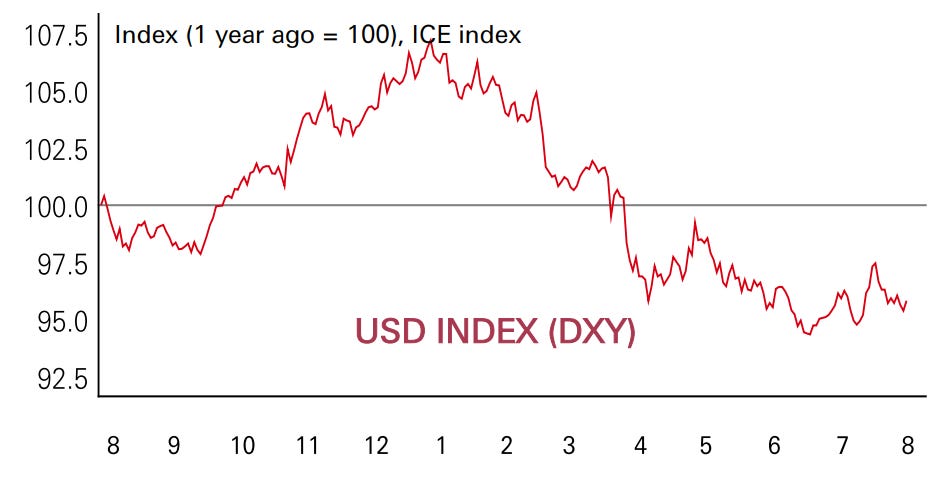
Is the party over for the dollar?
Another culprit in this year’s trade uncertainty has been the U.S. dollar. At the start of 2025, most investors expected it to strengthen, betting that Trump’s tax cuts and deregulation would extend America’s economic “exceptionalism.” Instead, tariffs have taken center stage, denting growth expectations and pushing the dollar down by roughly 10% so far this year.
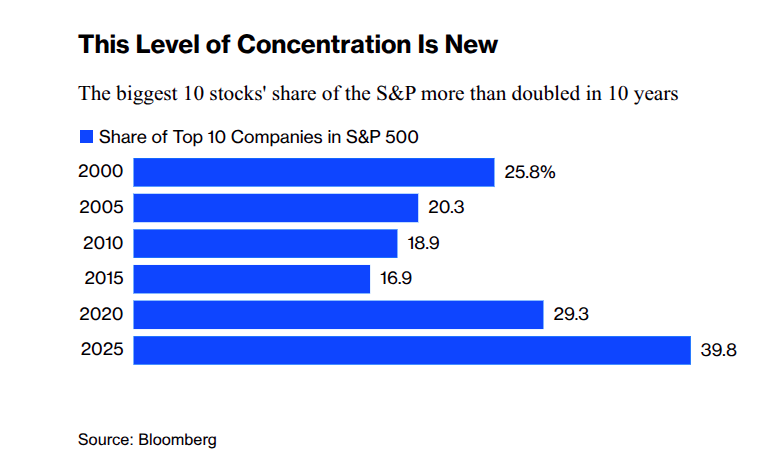
Yet even with the dollar sliding, U.S. stocks have bounced back from their post–Liberation Day sell-off to fresh all-time highs. The catch is that the rally has been heavily concentrated in tech and AI names, rather than reflecting broad economic strength.
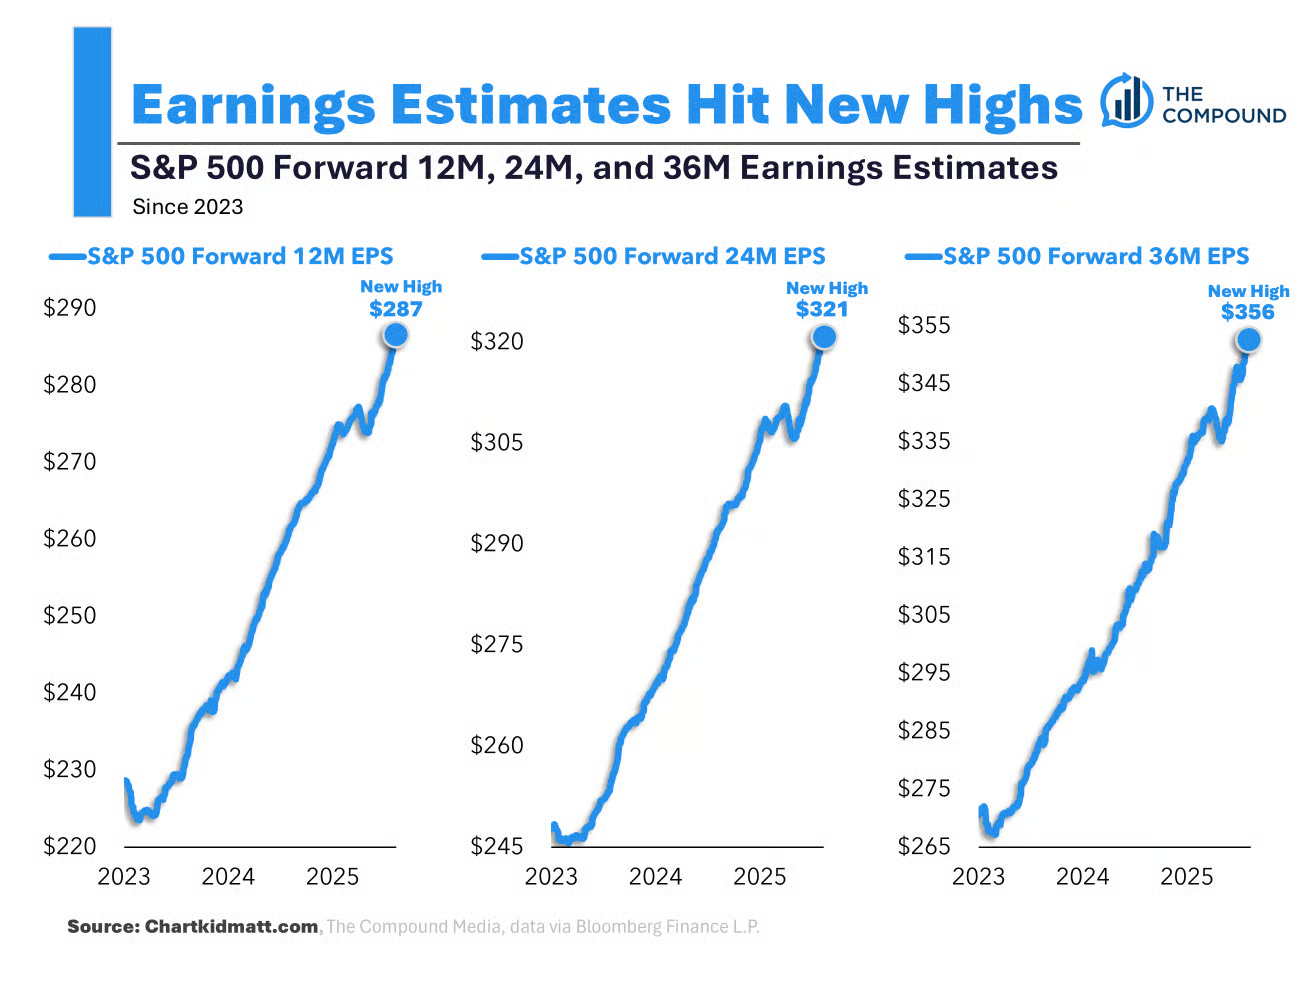
A weaker dollar does give U.S. companies with overseas sales a boost—exports get cheaper, and foreign earnings look bigger once converted back into dollars. And as this chart from The Compound shows, earnings estimates for U.S. companies are now sitting at record highs.
Will tariffs give a bigger shock to the global economy?
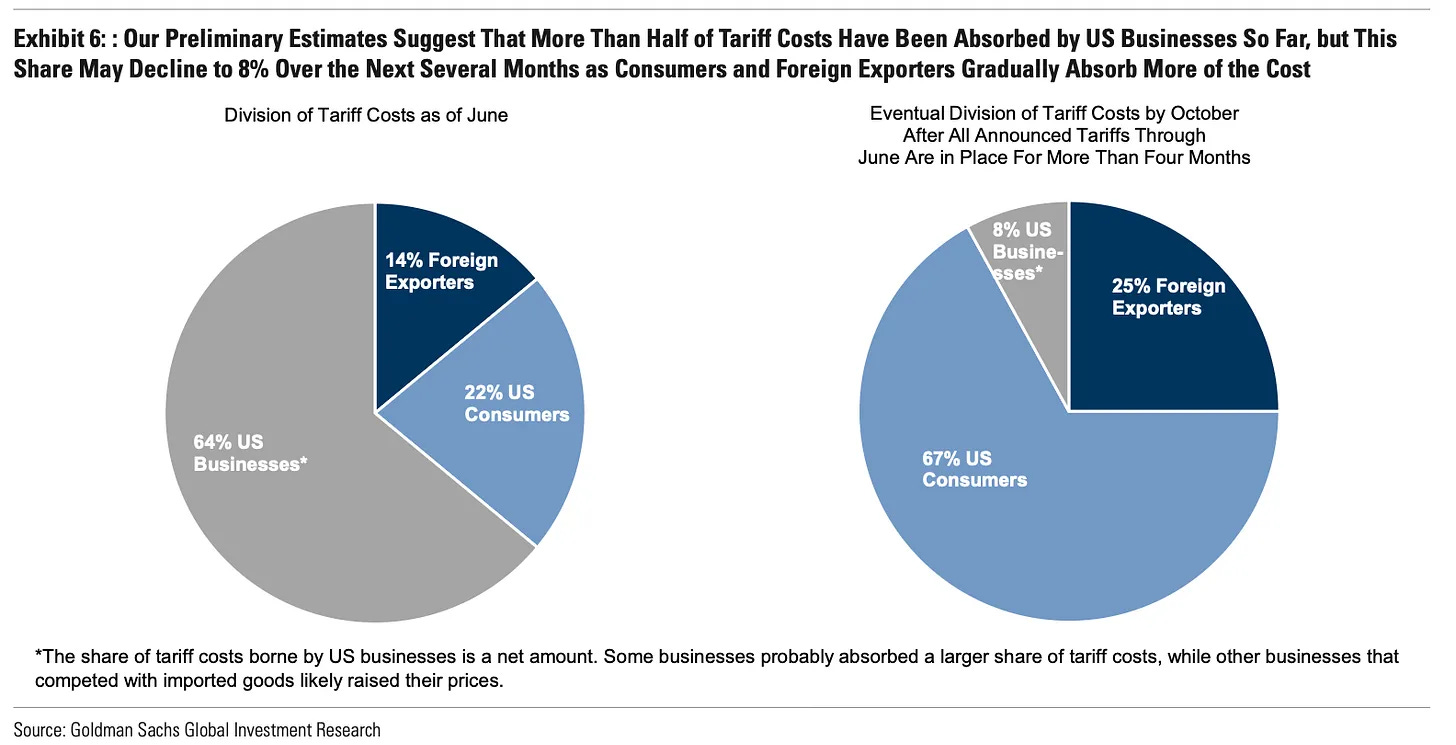
A recent Goldman Sachs report shows who’s really paying for U.S. tariffs. For now, it’s mostly American businesses. As of June, they were absorbing about two-thirds of the costs instead of passing them on to consumers, which has meant thinner profit margins. But that can’t last forever.
By October, Goldman projects the burden will flip—U.S. consumers will end up shouldering about two-thirds of the tariff costs. That means higher prices at the checkout counter, weaker demand, and stickier inflation. Foreign exporters will also feel more of the strain as trade slows.
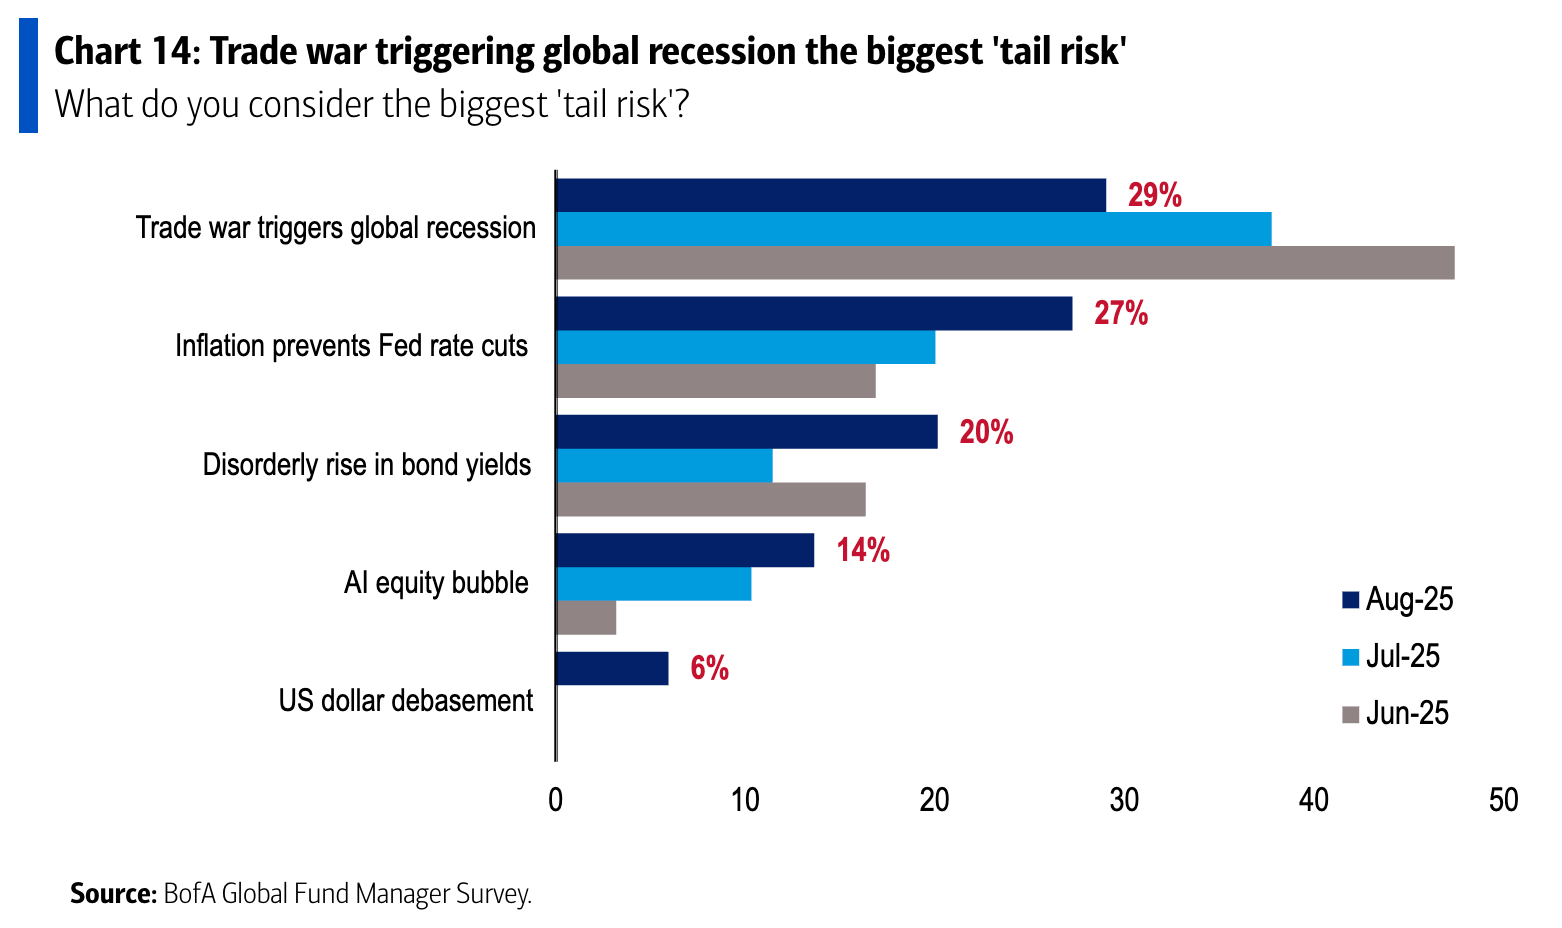
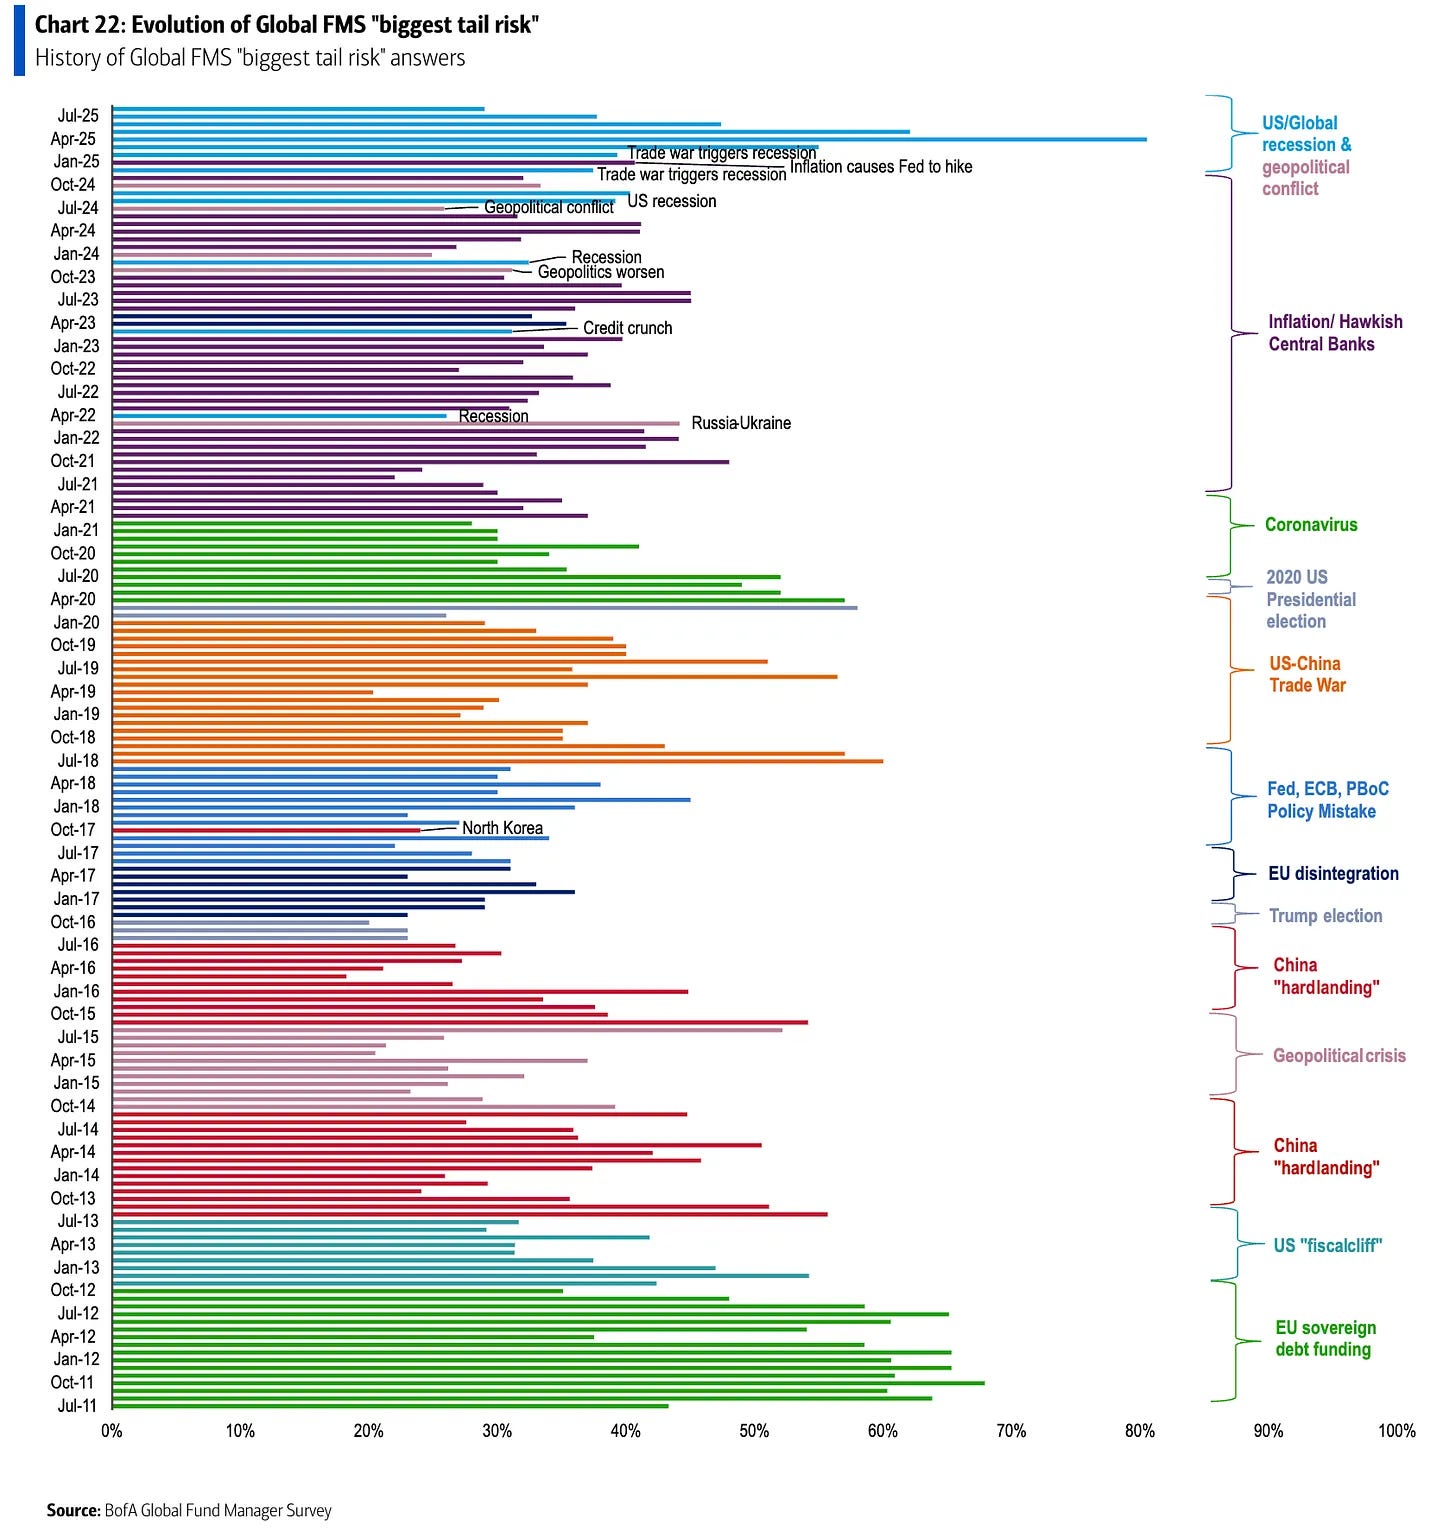
This brings us to how global fund managers see it. Bank of America’s latest survey shows that investors aren’t just worried about tariffs pushing up inflation—they see them as the single biggest threat to the world economy. In August, 29% of fund managers called a “trade war triggering a global recession” the top tail risk. That ranked ahead of worries about bond yields, an AI bubble, or even U.S. dollar weakness.
China’s stuck in a deflationary trap
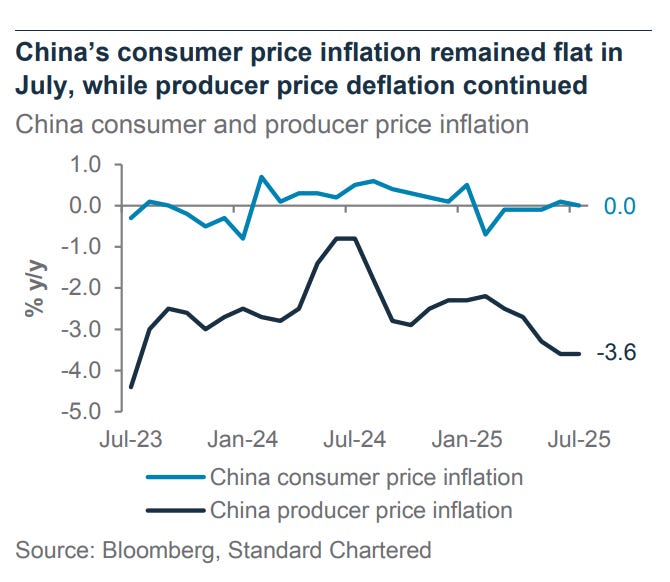
China is still stuck in deflation. In July 2025, consumer prices were flat compared to a year ago, showing households aren’t spending enough to push prices higher. Producer prices—what companies earn for their goods—fell 3.6% from last year. That makes it the 34th straight month of falling producer prices, the longest stretch in decades.
The reasons are familiar. Families are cautious about spending, weighed down by the property slump, high youth unemployment, and tighter finances. On the supply side, industries like EVs and solar are locked in fierce price cuts, as companies slash prices to protect market share. Exporters, facing U.S. tariffs and global competition, are cutting prices too, just to stay in the game.
Beijing has tried to boost demand and even launched an “anti-involution” campaign to discourage cutthroat pricing. But so far, little has changed—factories, shops, and investments are all losing momentum.
For the world, China’s deflation is a mixed bag. Selling goods abroad helps Chinese companies, and cheaper imports give consumers and central banks some relief. But it also makes life harder for local manufacturers, from steelmakers to carmakers, who can’t match China’s low costs. Good news for shoppers, bad news for factories.
That’s it for this edition. Thank you for reading. Do let us know your feedback in the comments.
Hi Team, can you add the option to read your newsletter in varsity app itself. Mailbox are full , substack platform is not focus friendly