With 2024 nearly behind us, it’s a great time to reflect on how the Indian markets and economy have fared this year. In this edition of Beyond The Charts, we’ll take a broader look at the ups and downs that shaped the past 12 months.
This post might break inside your email inbox. You can read the full post in a web browser by clicking here.
If you prefer watching video over reading, you can watch the episode here:
Markets performance
Let’s start with the stock markets. It’s been quite a roller coaster ride—from the record all-time highs and never-ending optimism to concerns about an economic slowdown, FIIs selling like there’s no tomorrow and eventual correction. It was an eventful year for markets.
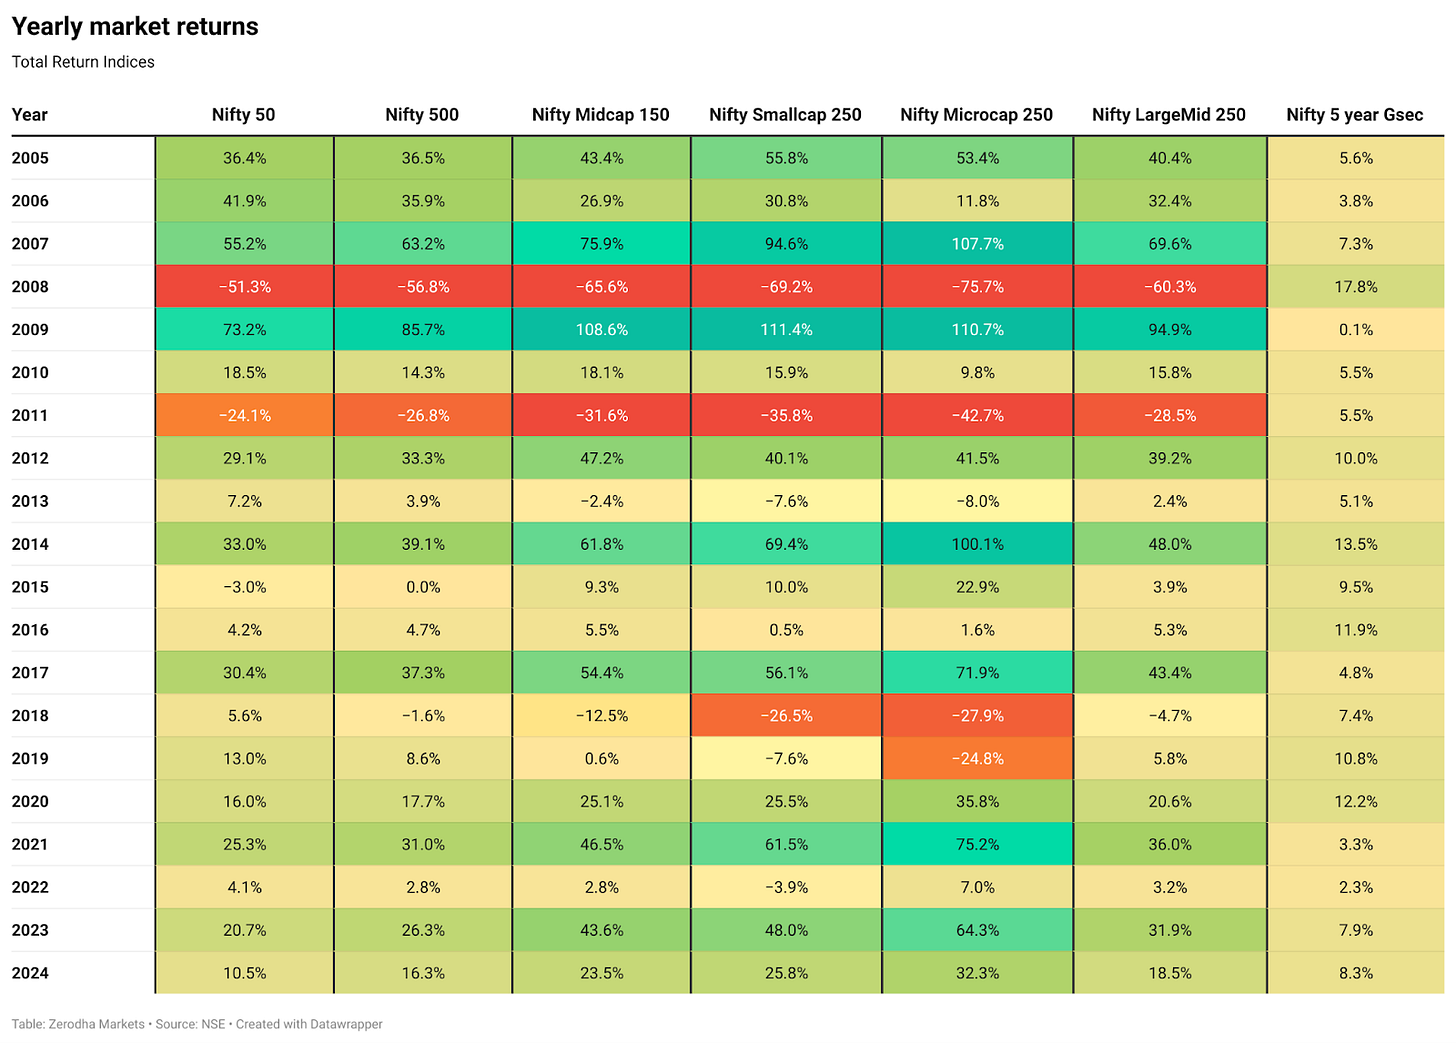
The Nifty 50 had its ups and downs, but it still closed the year with a solid gain of over 10.5%. The broader markets did even better—both the Midcap and Smallcap indices rose by more than 20%, while the Microcap index stood out with an impressive 32% increase.
Sectoral indices
When we look at specific sectors, real estate, healthcare, and pharmaceuticals are the stars of the year. These sectors delivered strong returns, with their indices climbing more than 30% during the year.
On the other hand, some of the usual market leaders had a quieter year. FMCG (Fast-Moving Consumer Goods) companies and private banks struggled to pick up pace, with their indices ending the year almost where they started in 2023. This flat performance from these key sectors, which often drive market growth, really stood out.
Factor indices
Let's break down how different investment strategies performed in 2024.
Factor investing—which focuses on specific stock characteristics - showed varying results this year. Value stocks (typically considered underpriced relative to their fundamentals) and Momentum stocks (those showing strong recent performance) beat the broader market, outperforming the Nifty 200 benchmark.
However, not all strategies worked well. Quality stocks (companies with strong balance sheets and stable earnings) and Low Volatility stocks (those that typically show smaller price swings) lagged behind the market.
For those new to investing, think of factor investing like this: Instead of just buying stocks of the biggest companies, you're choosing stocks based on specific traits. It's similar to how you might shop for a car - some people focus on fuel efficiency (like Quality stocks), while others look for performance (like Momentum stocks). Each approach has its moments of strength and weakness, as we saw this year.
Mutual funds
Despite market ups and downs, mutual funds saw remarkable growth, pulling in ₹9.14 lakh crores by November. Of this, over ₹3 lakh crores went into equity mutual funds alone.
This steady flow of domestic money was one of the key reasons Indian markets remained relatively stable, even when foreign investors (FIIs) were selling.
This trend also shows the maturity of Indian investors, who are increasingly choosing to invest rather than sitting on the sidelines or selling during market uncertainty.
Let's break down how different types of mutual funds performed in 2024.
Thematic funds focusing on specific sectors or trends were favorites among investors, attracting the biggest share of money. However, despite their popularity, these funds didn't manage to deliver the best returns.
The real winners were funds investing in mid-sized and smaller companies. Both midcap and smallcap funds outperformed their more specialized counterparts.
Looking back, 2024 proved to be a successful year for mutual funds across the board. Whether you invested in equity funds for potential growth, debt funds for stability, or hybrid funds for a balanced approach—all three major categories delivered positive returns.
Asset class performance
Looking at returns across different markets and assets. Equities were top performers amongst major asset classes—particularly the US and other developed markets, which managed to perform better compared to India and other emerging markets.
India’s increasing global stature
Indian markets have been one of the best-performing markets amongst emerging markets in recent years. Over the past year, India delivered a 25.4% return, second only to Taiwan. In the long term, India’s 20-year CAGR of 12.1% is the highest among emerging markets.
And this performance has certainly helped India increase its global stature.

Firstly, India’s weightage in the MSCI Emerging Market Index which tracks the performance of stocks over 20 emerging markets has seen a significant increase.
India’s weightage in this index has increased to 19.9% from 8.1% in 2020. At the same time, China’s weightage has dropped from a peak of 43% to around 27%.

Second, India’s share of global market capitalization has increased, now contributing around 4.3% to the world market cap compared to just 2.2% in 2020.

Commodities performance
In the commodities market, most commodity prices cooled down, while those of precious metals like gold and silver surged—prices of silver were up by over 28%, while those of gold were up around 27%.
This performance was largely driven by global tensions, and rate cuts, which pushed investors toward safer assets. Silver also gained from rising industrial demand in growing sectors like solar panels, electric vehicles, and electronics.
The general decline in other commodity prices was actually good news for consumers and businesses, as it helped ease inflation pressures.

Earnings
Let's examine how Indian businesses performed this year.
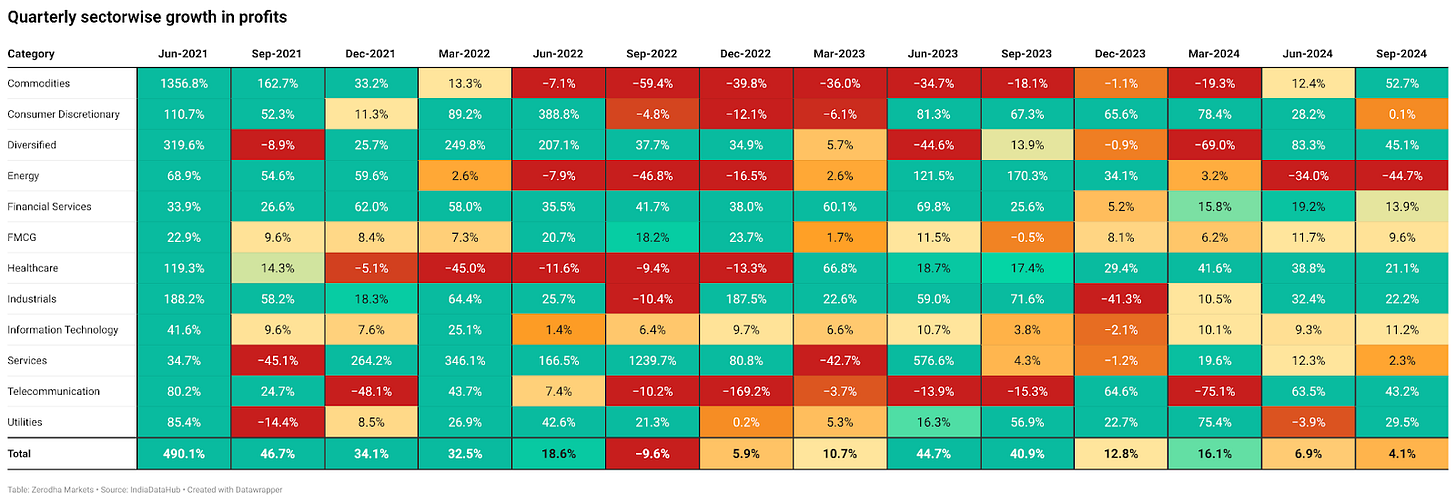
The July-September quarter was disappointing for corporate India. Many leading companies fell short of earnings expectations—a concerning sign given their high stock valuations.
Unfortunately, this isn’t a one-off, Companies have now posted weak, single-digit earnings growth for six consecutive quarters. Even more concerning is that profit growth has slowed to just 4.1% during this period, a noticeable drop from figures reported in September 2023.
The persistent slowdown in earnings is particularly noteworthy when you consider how strongly the stock markets performed. It raises questions about whether current stock prices accurately reflect company performance. When stock prices keep rising but company profits grow slowly, it often means stocks are becoming more expensive relative to their actual earnings.
Looking deeper at the relationship between company performance and market valuations. The combination of high stock prices and weak earnings growth eventually caught up with the markets.
After reaching peak levels in October, markets underwent a significant correction. This brought down the PE (Price-to-Earnings) ratios—a key measure of how expensive stocks are relative to their earnings across all market segments.
The Nifty 50's PE ratio, for example, has fallen from above 24 to around 21.8. Even Mid, small, and micro-cap indices have seen their valuations cool off.
Let’s look at another measure—the CAPE ratio. This metric has also declined across BSE Sensex and Nifty 500 indices in recent months, reflecting the market's response to the disappointing earnings we discussed earlier.
Think of CAPE as a longer-term valuation tool. While regular PE ratios are like taking a snapshot of a company's current earnings, CAPE looks at earnings over many years and accounts for economic ups and downs. This gives a more comprehensive view of whether the market is fundamentally overvalued or undervalued in the long run.

IPOs
2024 was a record-breaking year for India in terms of public issues. With over 301 companies going public until November, both through the main board and SME segments.
Together, these companies raised an impressive ₹1.41 lakh crores. The bigger companies led the charge with 75 of them listed on the main exchange and collecting ₹1.33 lakh crores.
226 small and medium-sized companies took their first step into public markets through NSE and BSE's SME platforms, raising about ₹8,400 crores together.
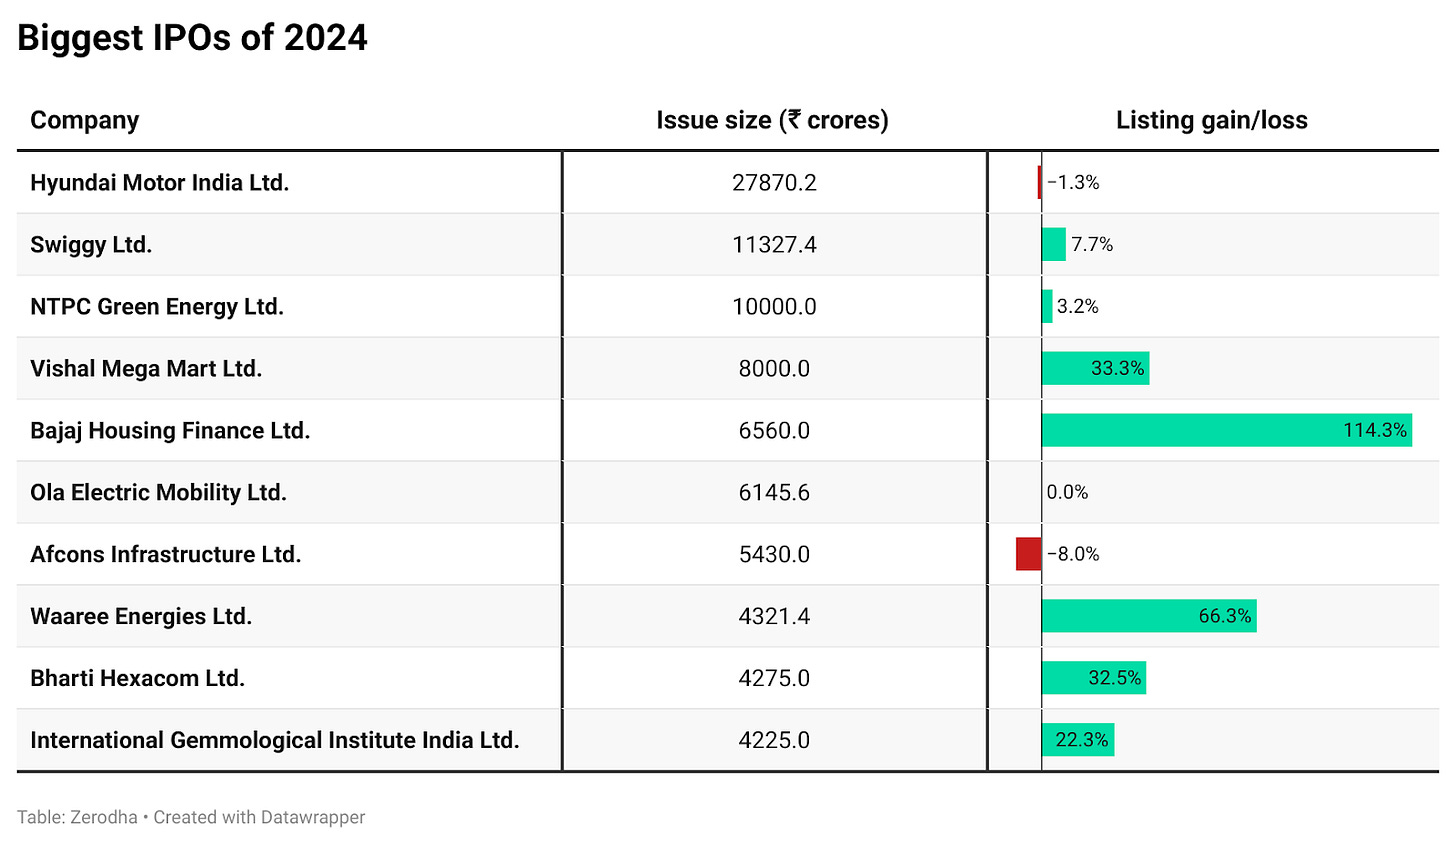
Collectively, the top 10 IPOs—featuring companies like Hyundai Motors, Swiggy, Vishal Mega Mart, Bajaj Housing Finance, and Ola Electric—accounted for Rs. 88,000 crores of the total proceeds.
India really stood out in the global IPO market in 2024. Here's something impressive—we led the world in terms of the number of companies going public. And when it came to the total money raised, India finished second globally, with only the United States ahead.


Growing investor base
The number of people investing in Indian markets kept growing strong in 2024. By November, there were more than 10.7 crore unique investors registered with NSE. What's even more impressive is that in just the first nine months of the financial year 2025, there has been the addition of 1.5 crore more investors.
The types of people investing in India are changing, and where they're coming from tells an interesting story. While investors used to be mostly from Western India, we're now seeing big changes across the country. With an increasing investor base in Northern and Eastern parts of India.
Northern India has seen an impressive rise, with its investor count reaching 3.8 crores—making it even bigger than the Western region.
This shows that investing is becoming popular across different parts of the country, not just in traditional financial centers.
Not only have we seen regional shifts, but investor demographics by age are also changing. More and more young people are coming to the market. Today, 4 out of every 10 investors are under 30 years old. That's a huge change from just five years ago when young investors made up less than a quarter of all investors.
FIIs vs DIIs
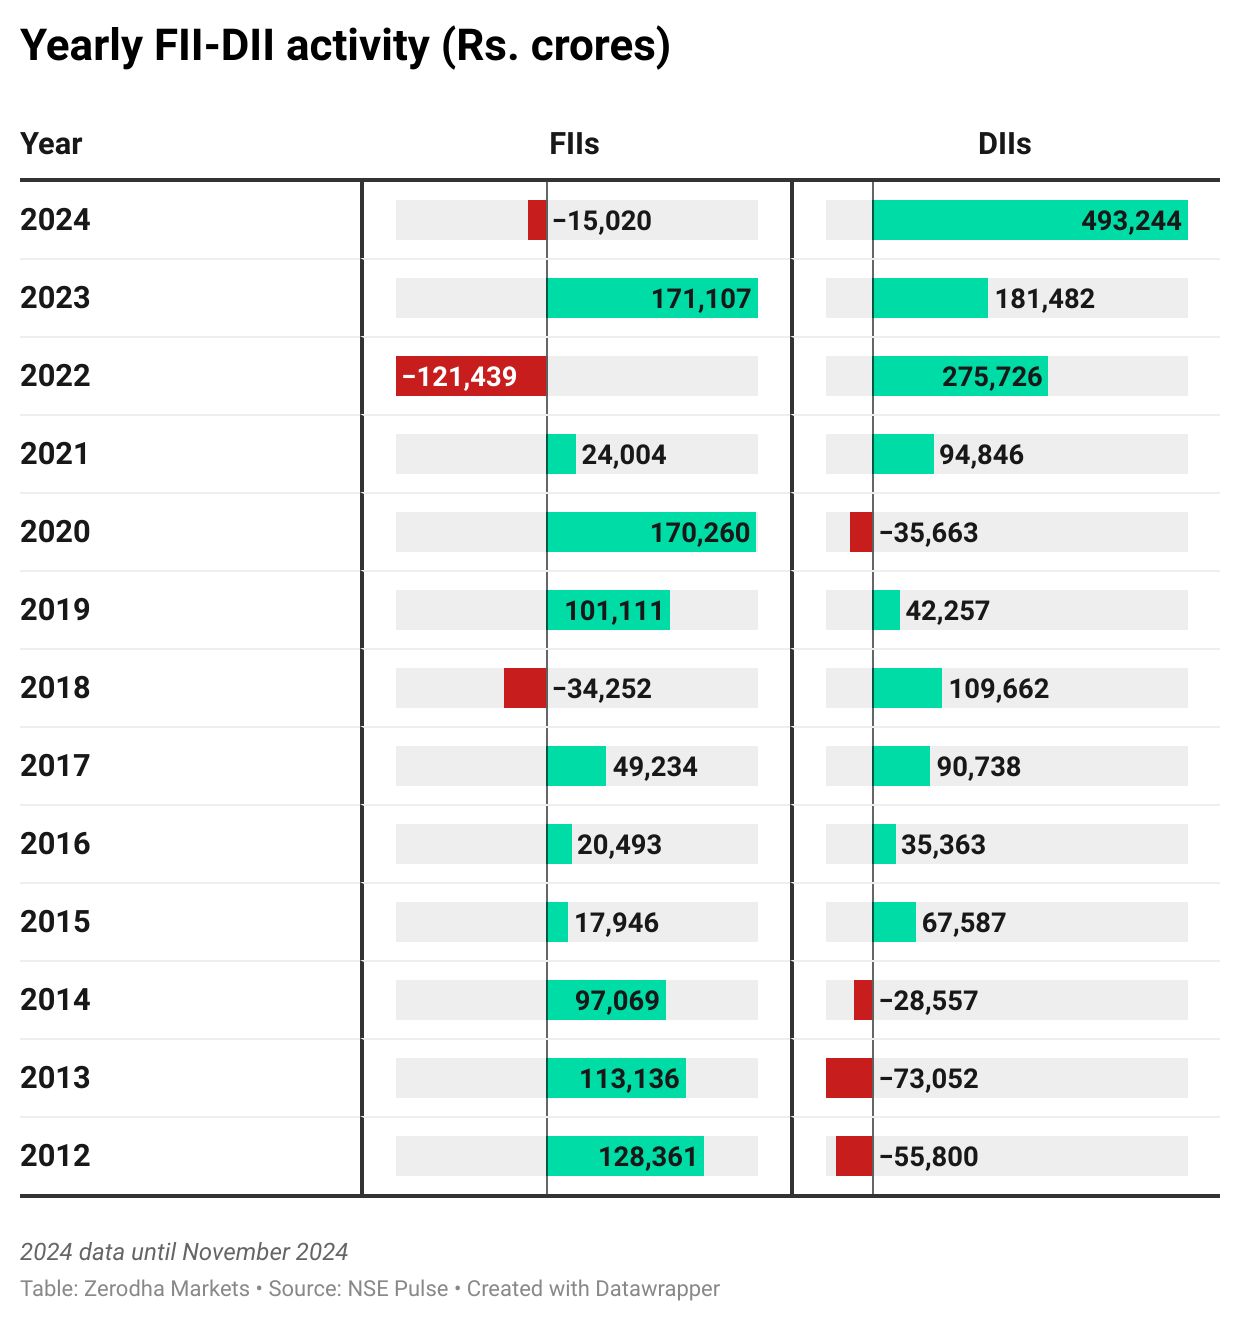
Foreign Institutional Investors (FIIs) have been pulling money out of Indian markets, especially in October and November. During these two months, they sold shares worth over Rs. 1.1 lakh crore, which triggered a market correction. However, looking at the full year, the situation seems less alarming: the net FII outflow in 2024 stands at around Rs. 15,000 crore.
Domestic Institutional Investors (DIIs), on the other hand, have been doing the opposite. In 2024, they’ve invested a hefty Rs. 4.93 lakh in the market.
Over the last five years—since 2020—there has been a noticeable change in how FIIs and DIIs invest. Between 2020 and now, FIIs invested about Rs. 2.3 lakh crore, while DIIs poured in around Rs. 10 lakh crore into Indian markets.
We can see this in other ownership patterns of both FIIs and DIIs.
FIIs have traditionally held the largest stake in Indian equities. However, their share has been on a steady decline since 2020 and is now at its lowest level in over a decade. At the same time, the share of DIIs has been on the rise.
If this trend continues, DIIs could soon overtake FIIs in terms of ownership.
Foreign Institutional Investors have been offloading shares in most emerging markets, not just in India. This year, they’ve been net buyers only in Indonesia and South Korea, while India, Brazil, Taiwan, and several other markets have seen net outflows in 2024.

Indian Economy
Now, let’s turn our attention to how the performance of the Indian economy.
India’s GDP growth slowed to 5.4% in the September quarter—the lowest in seven quarters and well below the RBI’s forecast of 6.7%.
This slowdown wasn’t a complete surprise, as several economic signs had already hinted at weaker growth. However, the size of the decline is significant. The main reasons were the poor performance of agriculture and manufacturing, two key parts of the economy. On top of that, government spending cuts, especially in big infrastructure projects, added to the overall slowdown.
Inflation
Inflation continues to be a big concern, putting a strain on household budgets. After easing earlier in 2024, it started climbing again in the second half of the year, mostly because of rising food prices. By November, overall inflation had reached 5.5%, with food prices rising even faster at 8.2%.
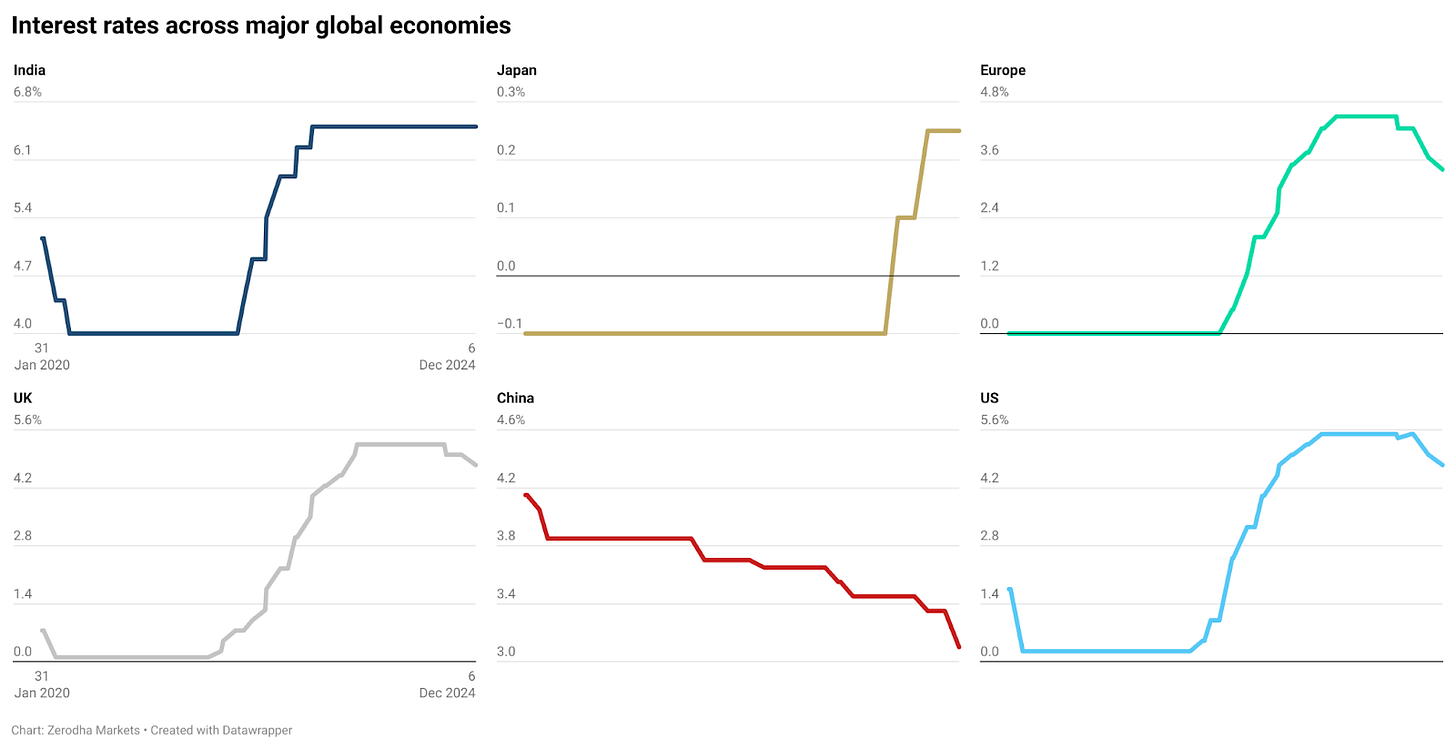
With inflation remaining high, the RBI has decided not to cut interest rates, unlike many other major economies that have started lowering theirs. While cutting rates could help boost growth, the RBI is being careful to avoid worsening the inflation problem.
Consumer confidence
The RBI’s consumer confidence survey provides insight into household sentiments regarding the economy, income, job prospects, inflation, and spending. The Current Situation Index—which reflects how people feel about the present state of the economy—dropped from 98 in March to 94 in November. This indicates that fewer people believe job opportunities, income, and overall economic conditions have improved compared to the previous year.
However, despite short-term concerns, optimism about the future remains strong. Households expect better job opportunities, higher incomes, and improved spending power in the coming year.
Auto sales
The automotive sector had a challenging year, with slow sales throughout 2024. While there was a small boost in vehicle purchases during the festive season in October, it didn’t last long. By November, sales of passenger cars and commercial vehicles dropped again, showing weak consumer demand and the impact of higher borrowing costs.
Industrial sector performance
India’s core sector industries—coal, steel, cement, electricity, and others—showed mixed performance. The index tracking these industries rebounded slightly in September and October, but growth levels remain low. This is the weakest growth since October 2022.
Breaking it down by sector gives us a clearer picture. Coal and steel production showed slight improvement, but most other sectors continued to decline. This shows that the small recovery in the overall index was mostly driven by these two industries, while the rest are still struggling to pick up pace.
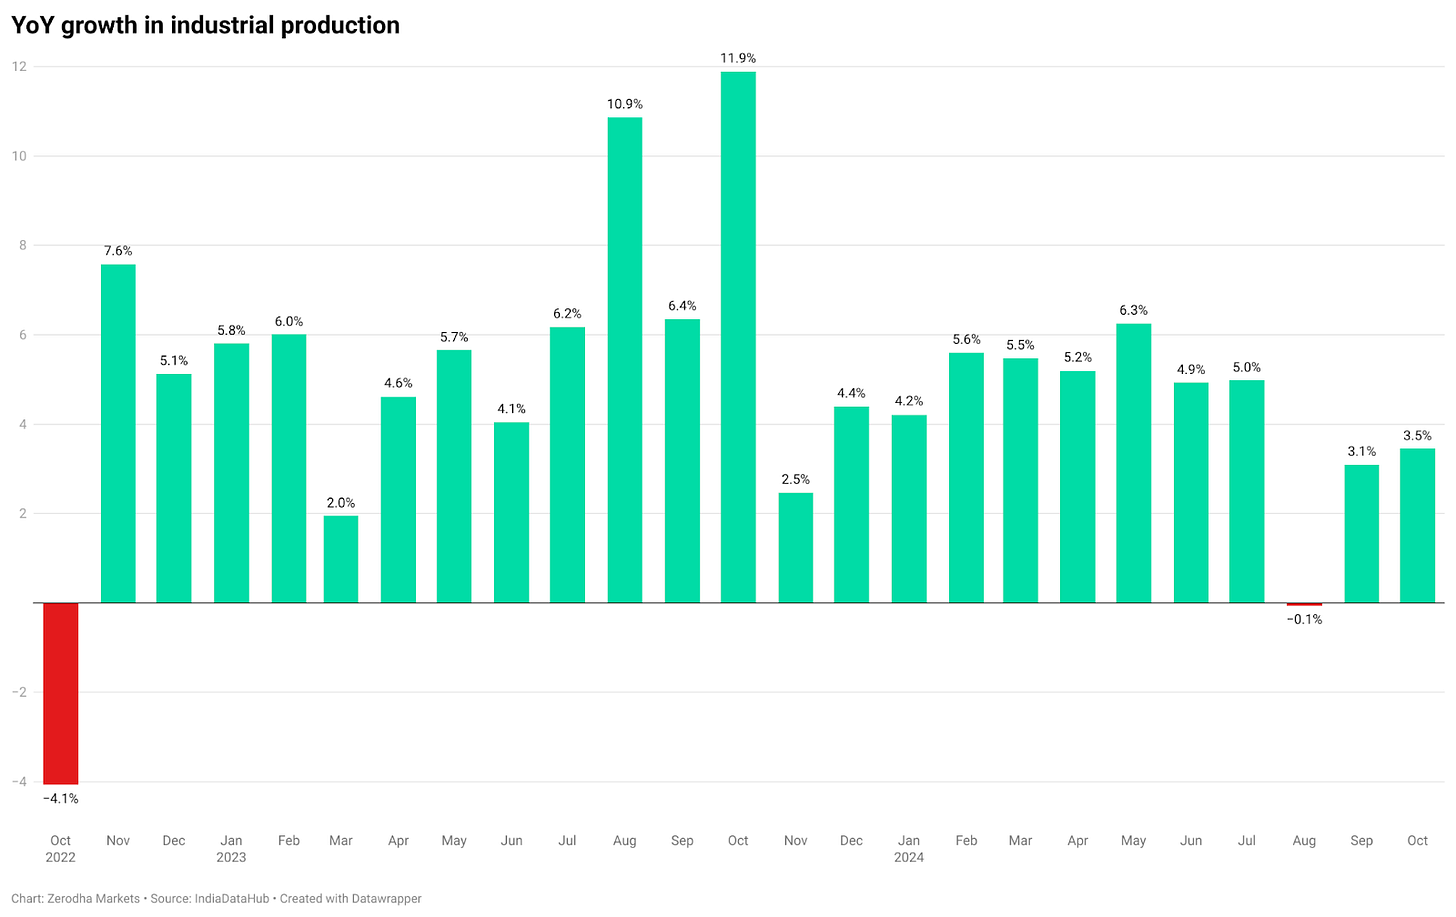
The slow performance of core sectors is clearly reflected in industrial production numbers. When key industries struggle, it pulls down overall industrial production. Although the growth rate of 3.5% in October was better than the previous two months, it’s still quite low—actually, it’s the weakest since November 2023.
Despite some slowdown, India’s manufacturing sector has remained resilient. Data from the HSBC India Manufacturing PMI showed continued expansion in November, even though the pace of growth softened.
Positive demand trends, especially from international markets, helped manufacturers maintain output levels. However, rising costs of inputs such as cotton, chemicals, and rubber pushed up production prices, limiting profit margins for many firms.

On the other hand, India’s services sector is also performing well. In November, services businesses—like transport, finance, and real estate—continued to grow strongly. India’s Services Purchasing Managers Index or PMI stayed high at 58.4, slightly down from 58.5 in October.
A major highlight is job creation. The services sector added new jobs at the fastest rate since the survey began in 2005. However, this growth also led to higher costs. Wages and food prices increased, resulting in the steepest price rises in nearly 12 years.

GST and E-way bill collections
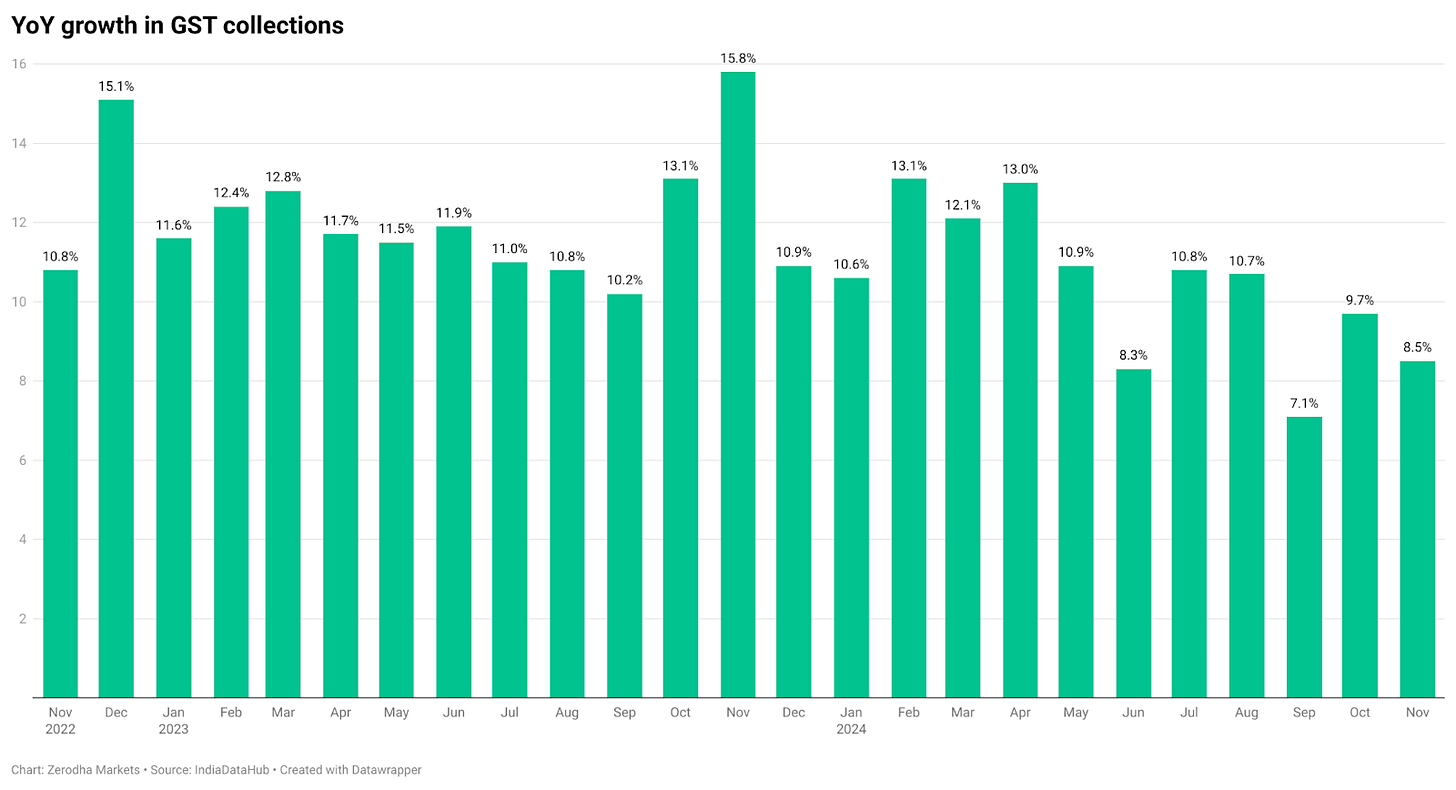
For the first time in three years, GST collections have grown by less than 10% over the past three months. Even with the festive season in September, October, and November, the growth didn’t meet expectations.
On the bright side, e-way bill generation—which tracks the movement of goods—has been strong, showing an 18% year-on-year increase. This indicates that while tax collections have slowed, trade and goods transportation remain active across the country.
To sum it up, while India’s economy continues to grow, the pace has slowed down recently. With some key sectors facing challenges, inflation is also proving to be stubborn straining household finances and slowing down spending on non-essentials.
That’s it from us today. Do share this with your friends to spread the word.
Also, if you have any feedback, do let us know in the comments.













Ultimate analysis
Hats off
How did the net FII outflow just came around 15000? Could you explain that a bit